Watch 10 video solutions for Minimum Lines to Represent a Line Chart, a medium level problem involving Array, Math, Geometry. This walkthrough by Coding Decoded has 1,303 views views. Want to try solving it yourself? Practice on FleetCode or read the detailed text solution.
You are given a 2D integer array stockPrices where stockPrices[i] = [dayi, pricei] indicates the price of the stock on day dayi is pricei. A line chart is created from the array by plotting the points on an XY plane with the X-axis representing the day and the Y-axis representing the price and connecting adjacent points. One such example is shown below:
Return the minimum number of lines needed to represent the line chart.
Example 1:
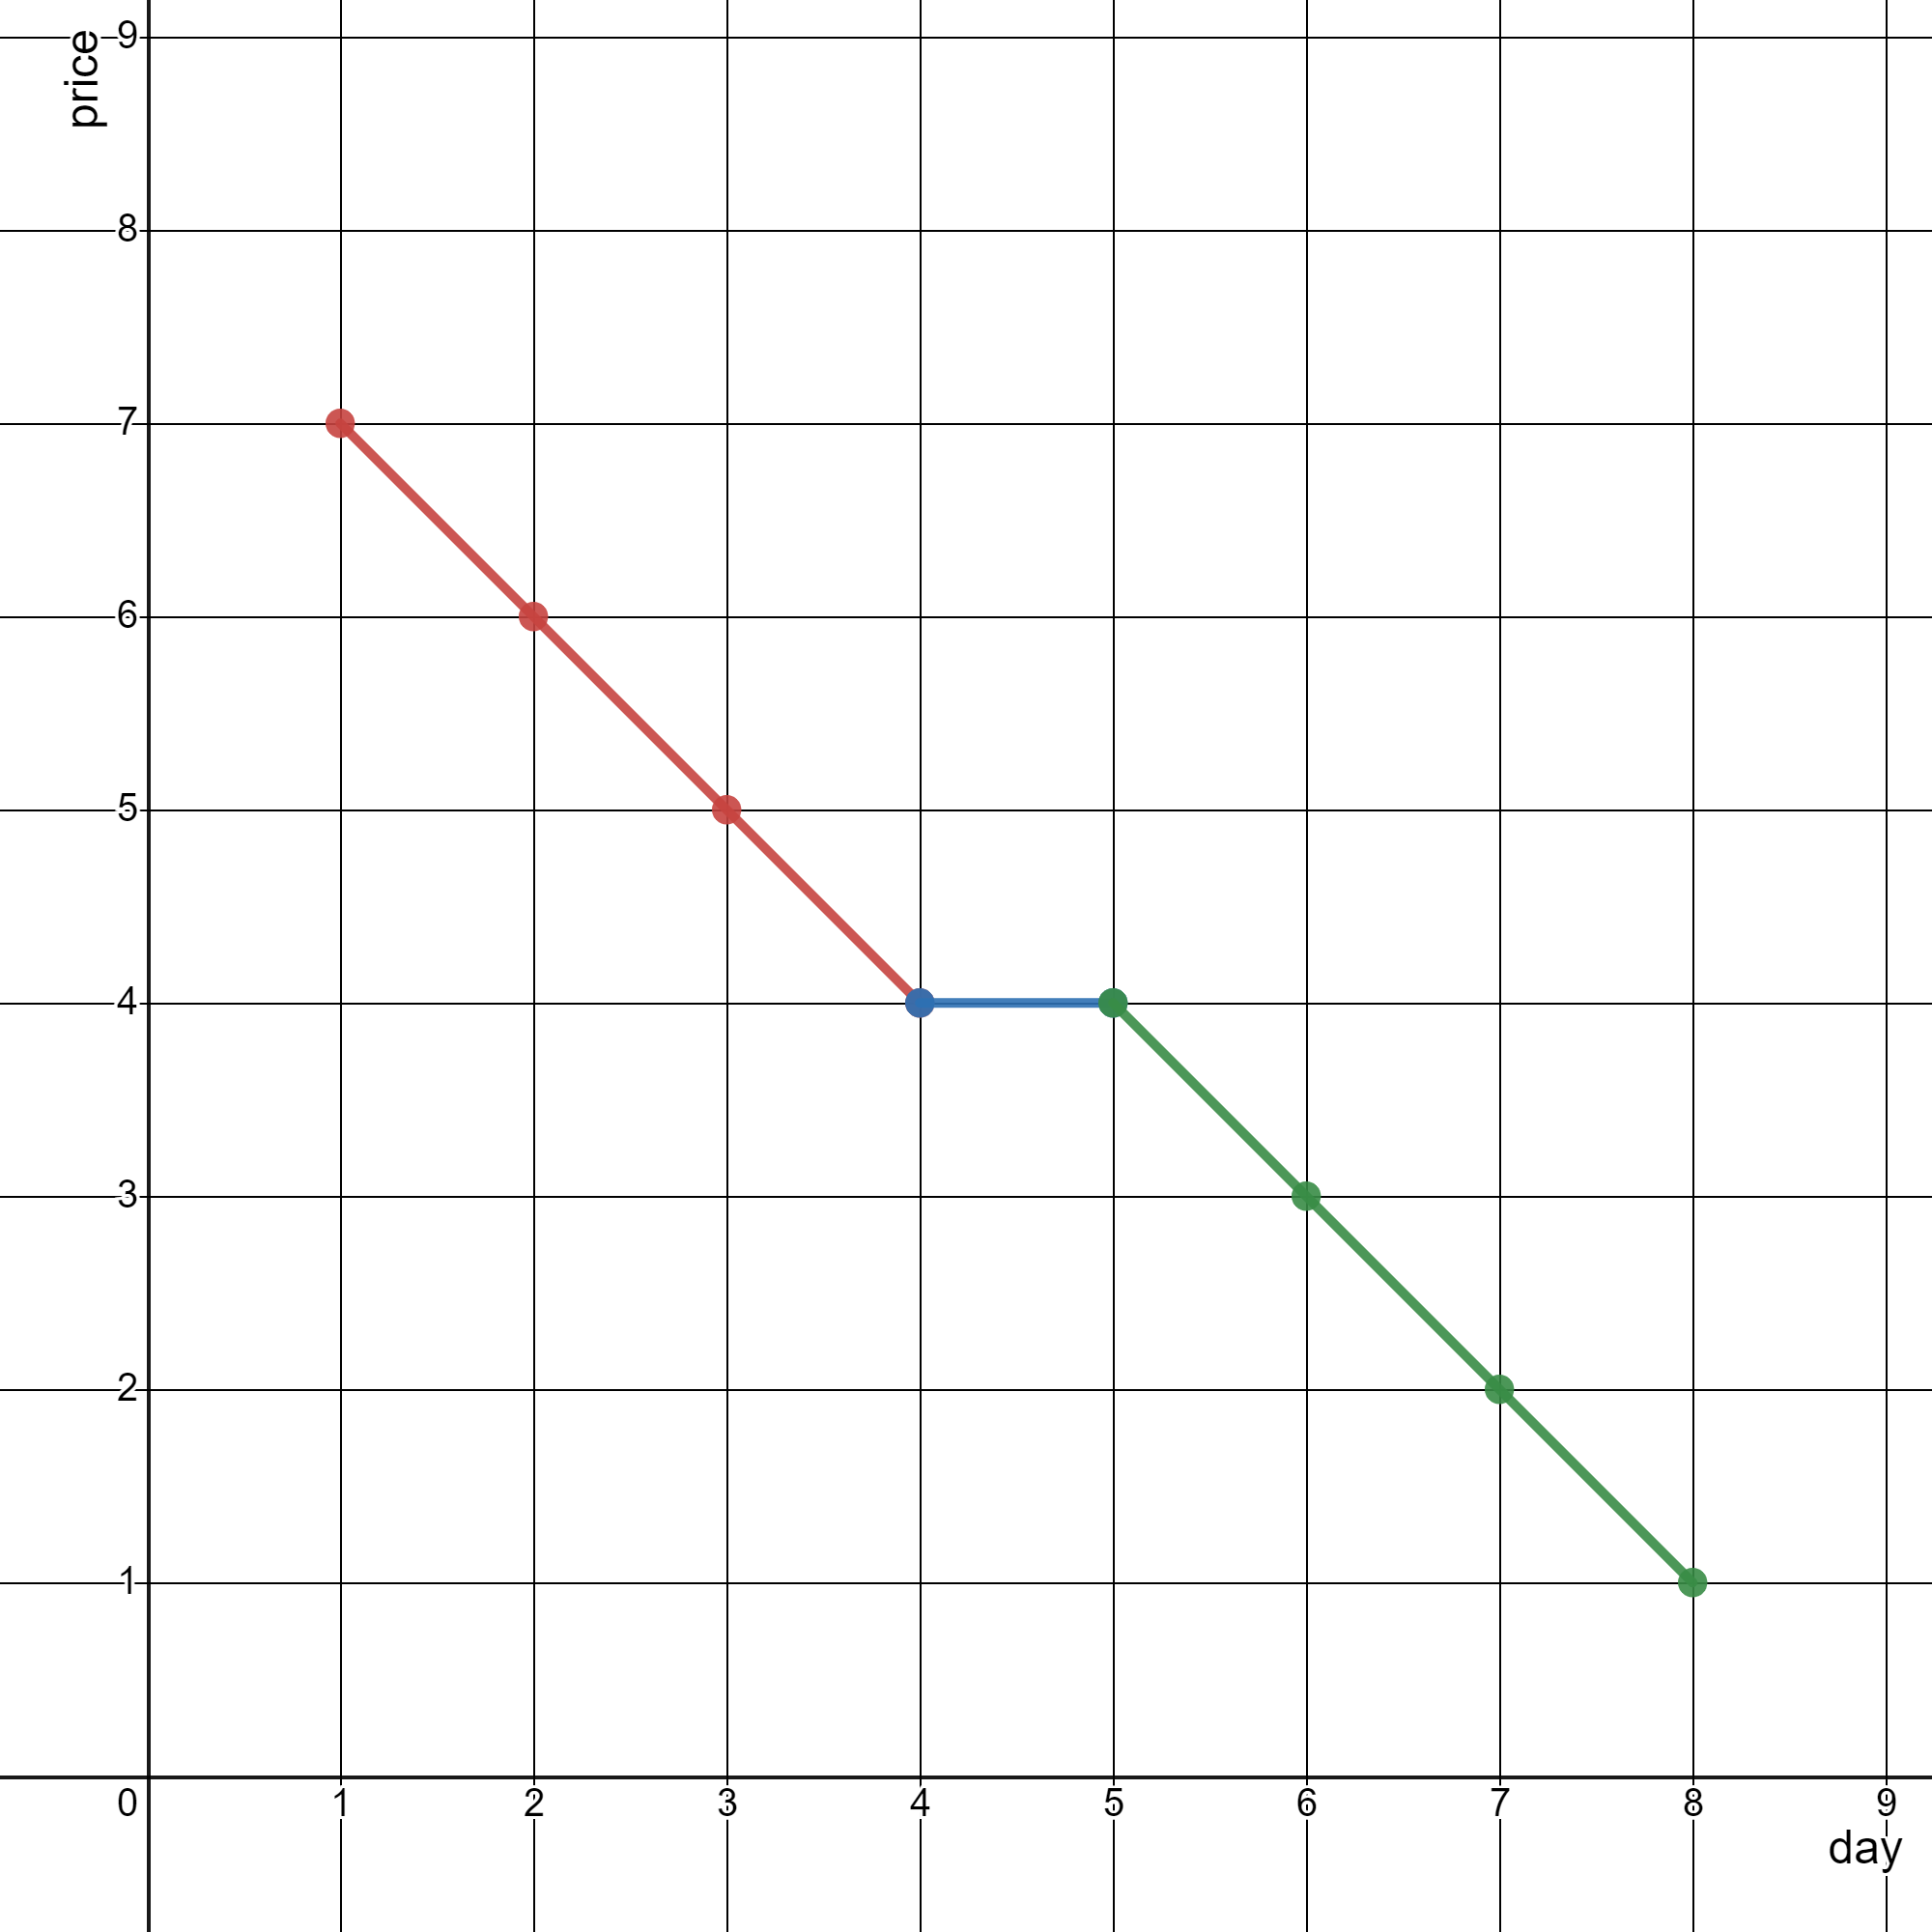
Input: stockPrices = [[1,7],[2,6],[3,5],[4,4],[5,4],[6,3],[7,2],[8,1]]
Output: 3
Explanation:
The diagram above represents the input, with the X-axis representing the day and Y-axis representing the price.
The following 3 lines can be drawn to represent the line chart:
- Line 1 (in red) from (1,7) to (4,4) passing through (1,7), (2,6), (3,5), and (4,4).
- Line 2 (in blue) from (4,4) to (5,4).
- Line 3 (in green) from (5,4) to (8,1) passing through (5,4), (6,3), (7,2), and (8,1).
It can be shown that it is not possible to represent the line chart using less than 3 lines.
Example 2:
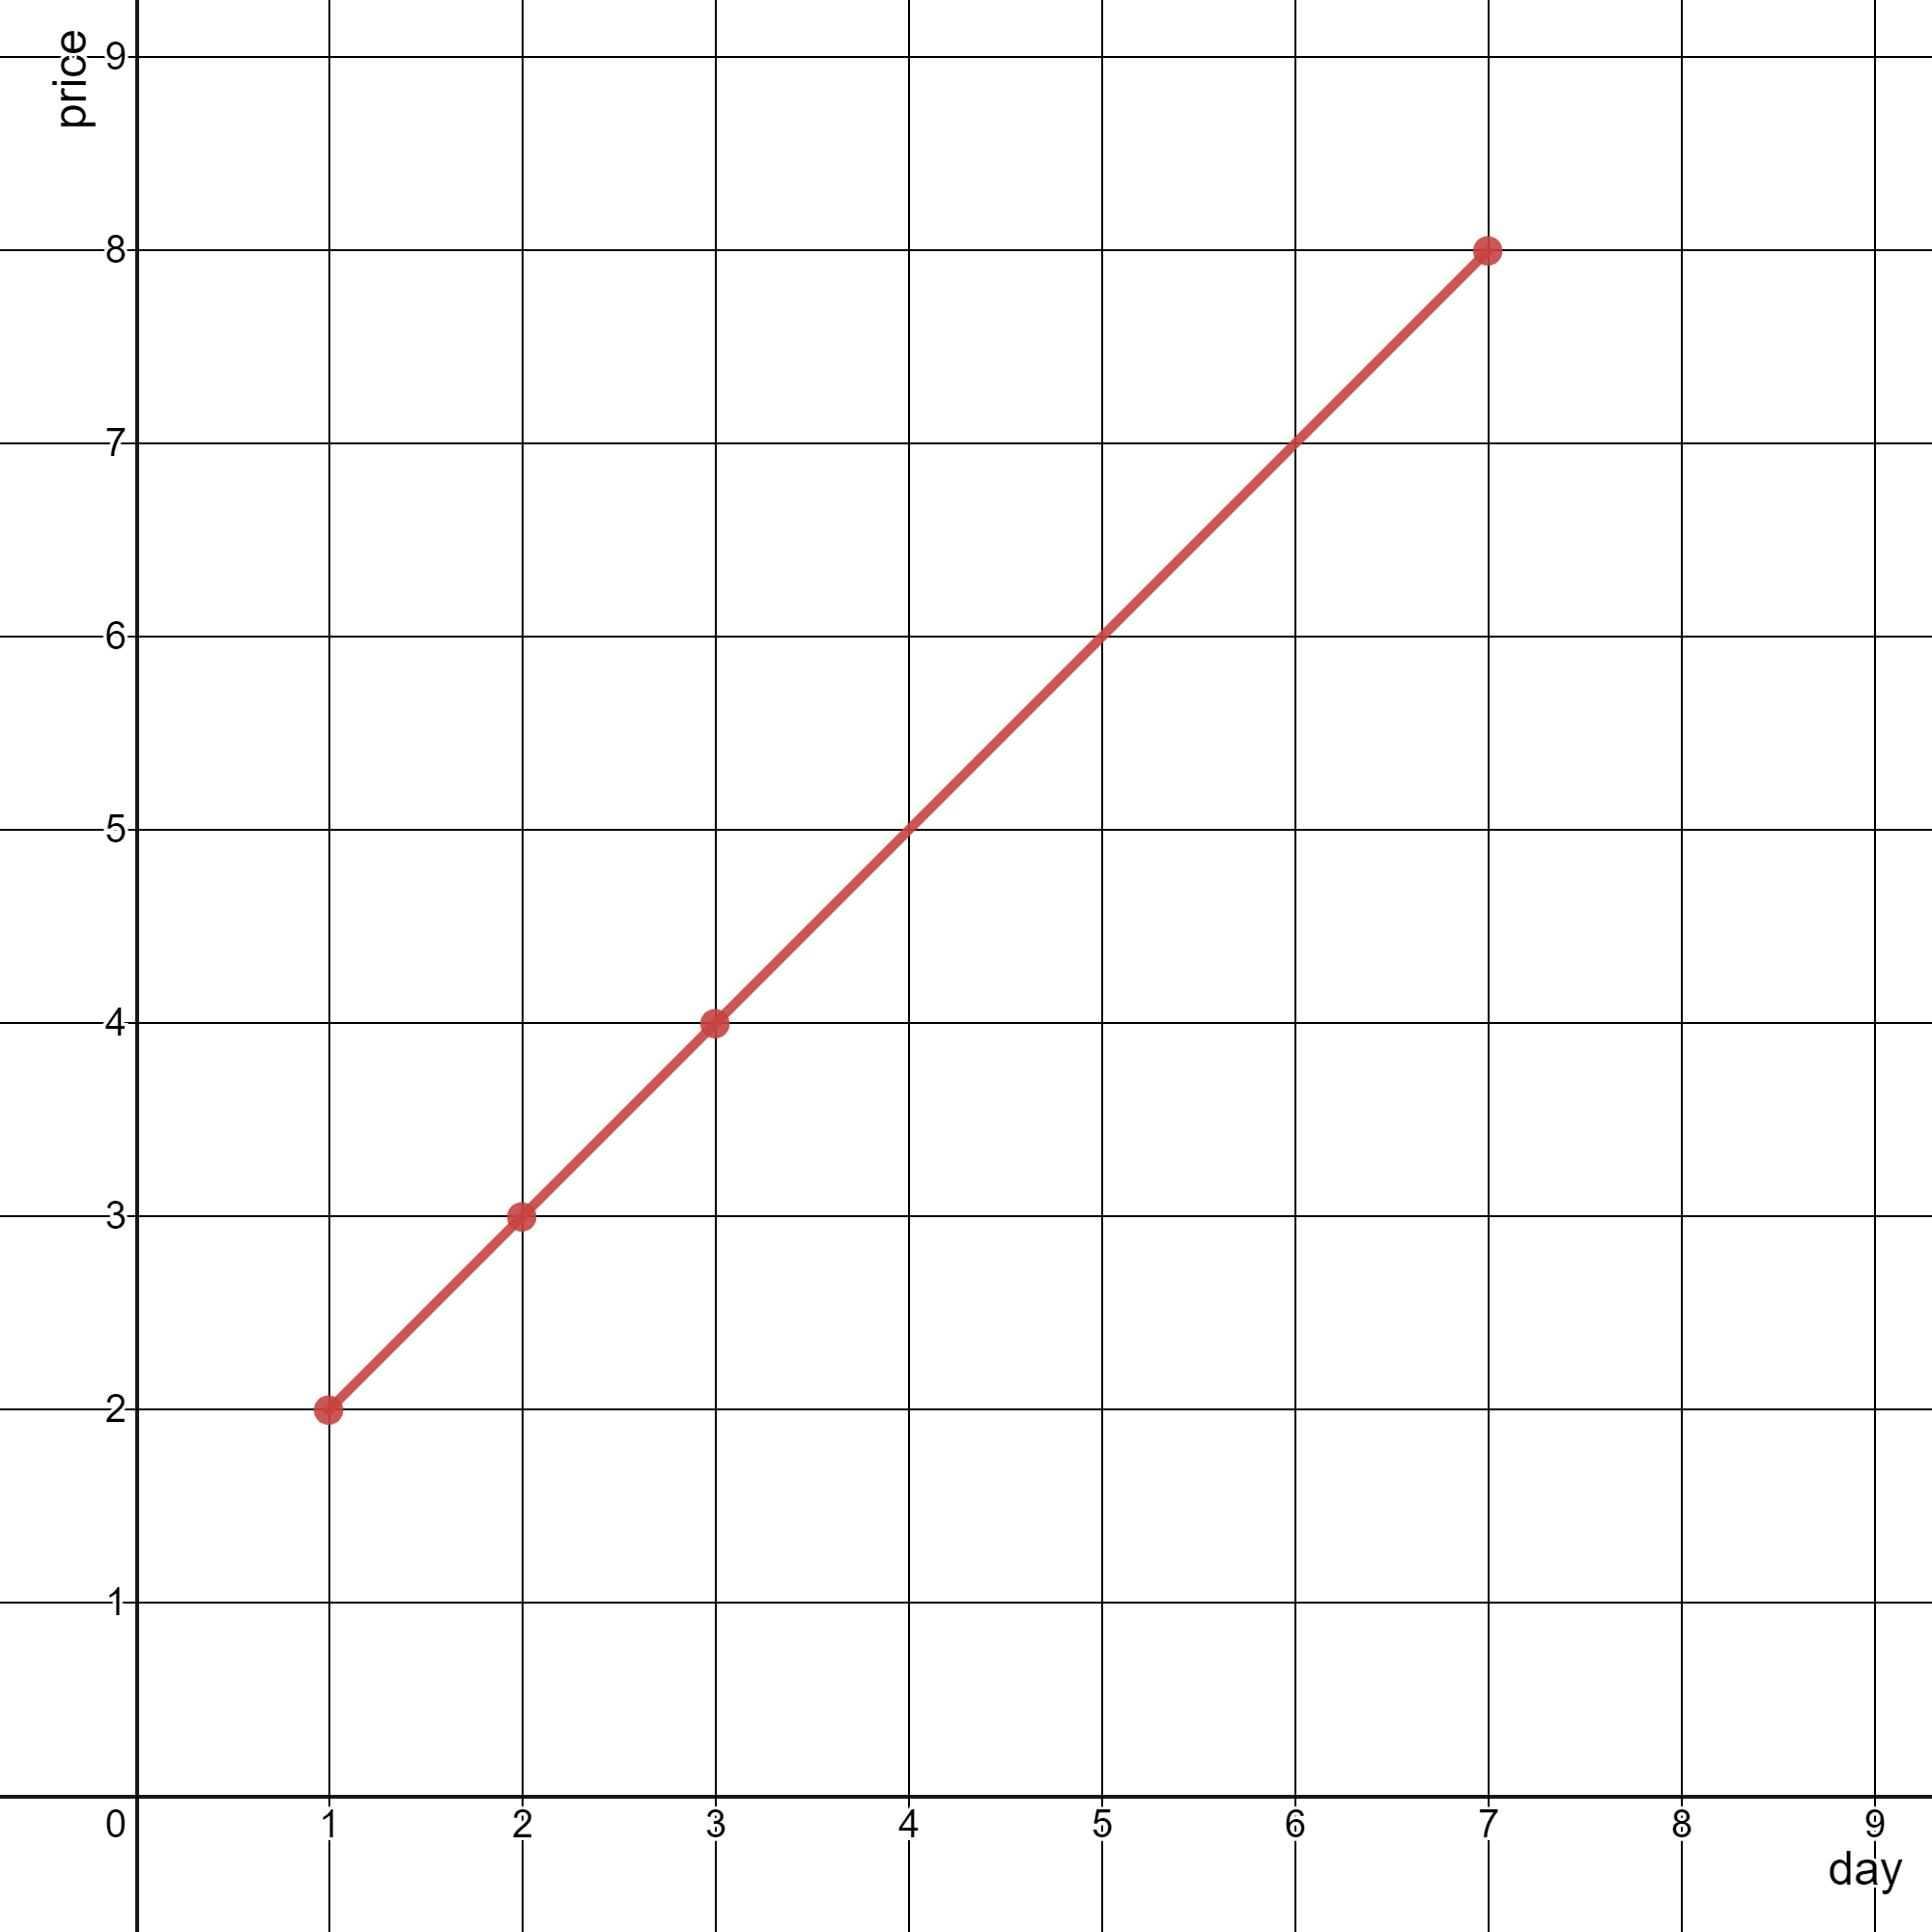
Input: stockPrices = [[3,4],[1,2],[7,8],[2,3]]
Output: 1
Explanation:
As shown in the diagram above, the line chart can be represented with a single line.
Constraints:
1 <= stockPrices.length <= 105stockPrices[i].length == 21 <= dayi, pricei <= 109dayi are distinct.Problem Overview: You receive stock prices as [day, price] points. After sorting by day, the chart connects points with straight segments. The goal is to compute the minimum number of straight lines needed so consecutive points that share the same slope belong to the same segment.
Approach 1: Using Slopes and Collinearity (O(n log n) time, O(1) space)
First sort the points by day using a standard sorting step. Then iterate through the array and compute the slope between consecutive points. If three consecutive points are collinear, they belong to the same line segment, so you continue without increasing the line count. Instead of floating-point division, compare slopes using cross multiplication: (y2 - y1) * (x3 - x2) == (y3 - y2) * (x2 - x1). This avoids precision issues and relies purely on integer arithmetic from math and geometry. Every time the slope changes, increment the line counter.
Approach 2: Incremental Line Count with Direct Comparison (O(n log n) time, O(1) space)
This approach focuses on counting line segments as you traverse the sorted array. After sorting by day, start with one line segment between the first two points. For each new point, compare the slope of the last segment with the slope formed by the current pair. If the slopes differ, a new line segment must start, so increment the count. The comparison again uses cross multiplication instead of division. The logic is simple: iterate once, compute slope relationships, and maintain a running count of segments.
Recommended for interviews: The incremental slope comparison approach is typically expected. It shows you understand how to detect collinearity without floating-point errors and how sorting enables a single linear pass. Interviewers usually look for the O(n log n) solution (due to sorting) with constant extra space and integer slope comparison.
| Approach | Time | Space | When to Use |
|---|---|---|---|
| Using Slopes and Collinearity | O(n log n) | O(1) | General case when points are unsorted and you need accurate slope comparison without floating-point errors |
| Incremental Line Count with Direct Comparison | O(n log n) | O(1) | Preferred interview solution after sorting; simple linear pass and easy slope checks |