Watch 5 video solutions for Count Fertile Pyramids in a Land, a hard level problem involving Array, Dynamic Programming, Matrix. This walkthrough by code Explainer has 1,395 views views. Want to try solving it yourself? Practice on FleetCode or read the detailed text solution.
A farmer has a rectangular grid of land with m rows and n columns that can be divided into unit cells. Each cell is either fertile (represented by a 1) or barren (represented by a 0). All cells outside the grid are considered barren.
A pyramidal plot of land can be defined as a set of cells with the following criteria:
1 and all cells must be fertile.(r, c) be the apex of the pyramid, and its height be h. Then, the plot comprises of cells (i, j) where r <= i <= r + h - 1 and c - (i - r) <= j <= c + (i - r).An inverse pyramidal plot of land can be defined as a set of cells with similar criteria:
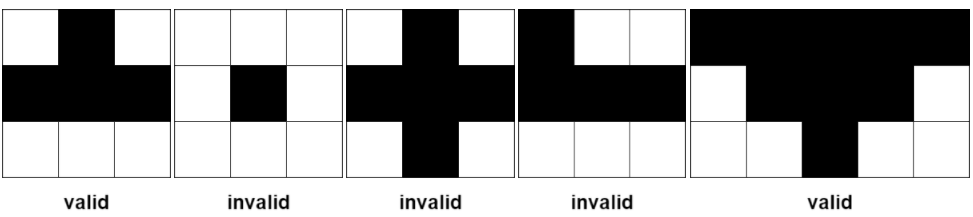
1 and all cells must be fertile.(r, c) be the apex of the pyramid, and its height be h. Then, the plot comprises of cells (i, j) where r - h + 1 <= i <= r and c - (r - i) <= j <= c + (r - i).Some examples of valid and invalid pyramidal (and inverse pyramidal) plots are shown below. Black cells indicate fertile cells.
Given a 0-indexed m x n binary matrix grid representing the farmland, return the total number of pyramidal and inverse pyramidal plots that can be found in grid.
Example 1:

Input: grid = [[0,1,1,0],[1,1,1,1]]
Output: 2
Explanation: The 2 possible pyramidal plots are shown in blue and red respectively.
There are no inverse pyramidal plots in this grid.
Hence total number of pyramidal and inverse pyramidal plots is 2 + 0 = 2.
Example 2:

Input: grid = [[1,1,1],[1,1,1]]
Output: 2
Explanation: The pyramidal plot is shown in blue, and the inverse pyramidal plot is shown in red.
Hence the total number of plots is 1 + 1 = 2.
Example 3:

Input: grid = [[1,1,1,1,0],[1,1,1,1,1],[1,1,1,1,1],[0,1,0,0,1]]
Output: 13
Explanation: There are 7 pyramidal plots, 3 of which are shown in the 2nd and 3rd figures.
There are 6 inverse pyramidal plots, 2 of which are shown in the last figure.
The total number of plots is 7 + 6 = 13.
Constraints:
m == grid.lengthn == grid[i].length1 <= m, n <= 10001 <= m * n <= 105grid[i][j] is either 0 or 1.Problem Overview: You are given a binary grid where 1 represents fertile land and 0 represents barren land. A pyramid plot is a triangular region of fertile cells expanding downward (or upward for inverse pyramids). The task is to count all valid pyramids of height ≥ 2 that can be formed in the grid.
Approach 1: Dynamic Programming - Bottom-Up for Pyramidal Plot (O(m*n) time, O(m*n) space)
This method detects downward pyramids using dynamic programming over the grid. For each cell, compute the maximum pyramid height with that cell as the apex. A pyramid of height h requires the three cells directly below (left, center, right) to support a pyramid of height h-1. Store the height in a DP matrix while iterating from bottom to top. The number of pyramids contributed by a cell is dp[i][j] - 1. This works because every extra level forms a larger pyramid. The approach scans each cell once and uses local transitions, making it efficient for large matrix inputs.
Approach 2: Dynamic Programming - Top-Down for Inverse Pyramidal Plot (O(m*n) time, O(m*n) space)
Inverse pyramids expand upward instead of downward. The idea mirrors the previous DP but flips the traversal direction. Iterate from top to bottom and compute how large an inverted pyramid can be with the current cell as the bottom apex. The DP state again depends on three supporting cells in the previous row. By maintaining a similar transition formula, you count all inverted pyramids efficiently. Combining counts from both passes ensures every valid pyramid orientation is included. The algorithm relies only on local neighbors and sequential traversal across the array-backed grid.
Recommended for interviews: Interviewers expect the dynamic programming approach with two passes. The key insight is realizing that pyramid height can be derived from the minimum height of three supporting cells. A brute-force approach checking every possible triangle would be O(m*n*min(m,n)) and too slow. Demonstrating the DP transition and counting contribution height - 1 shows strong pattern recognition with matrix DP problems.
| Approach | Time | Space | When to Use |
|---|---|---|---|
| Dynamic Programming (Bottom-Up for Pyramidal Plot) | O(m*n) | O(m*n) | Counting downward pyramids efficiently using DP transitions from lower rows |
| Dynamic Programming (Top-Down for Inverse Pyramidal Plot) | O(m*n) | O(m*n) | Required to count inverted pyramids expanding upward in the grid |