You are given a 2D array of axis-aligned rectangles. Each rectangle[i] = [xi1, yi1, xi2, yi2] denotes the ith rectangle where (xi1, yi1) are the coordinates of the bottom-left corner, and (xi2, yi2) are the coordinates of the top-right corner.
Calculate the total area covered by all rectangles in the plane. Any area covered by two or more rectangles should only be counted once.
Return the total area. Since the answer may be too large, return it modulo 109 + 7.
Example 1:
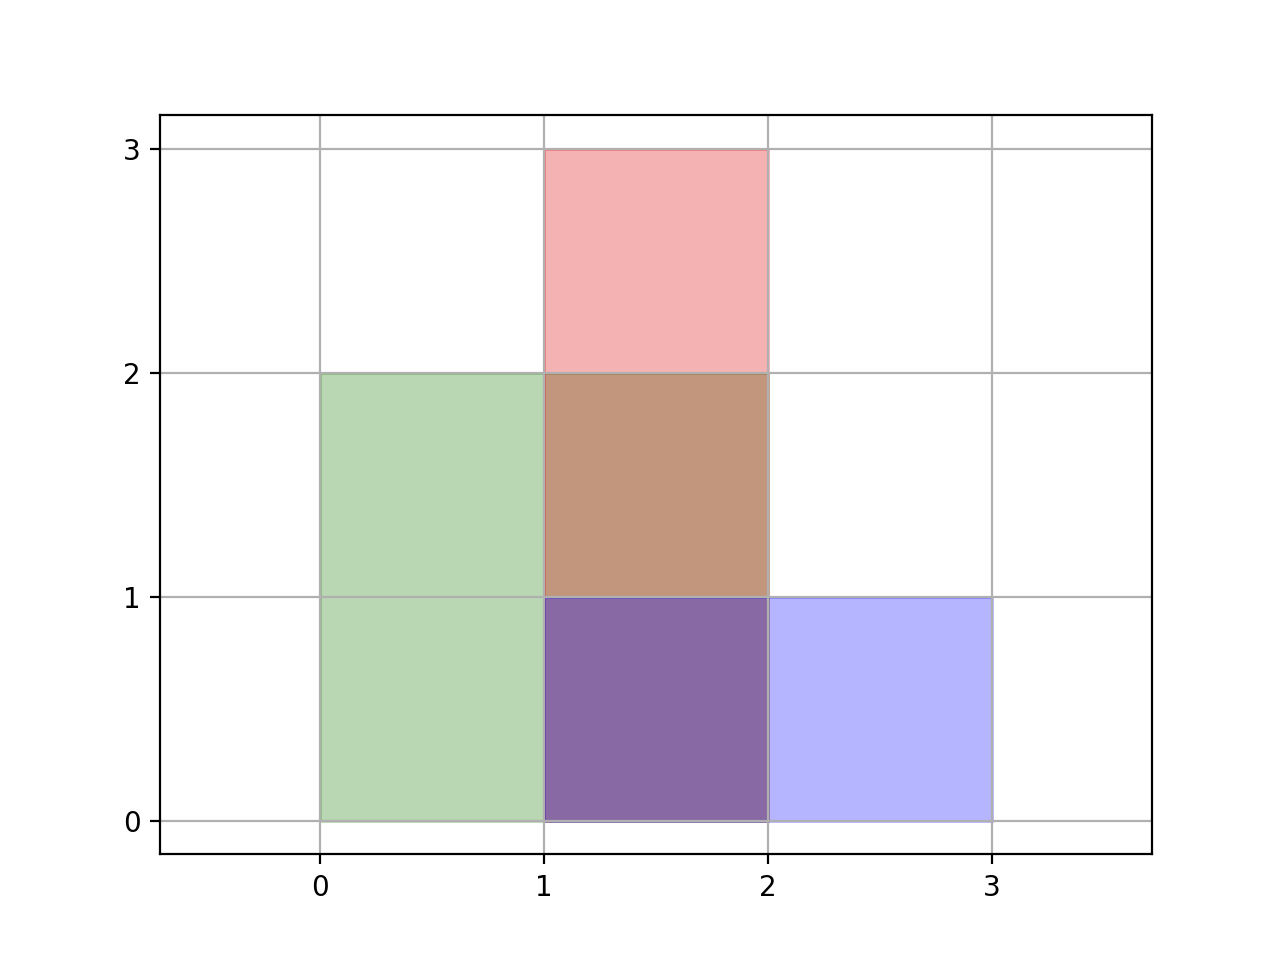
Input: rectangles = [[0,0,2,2],[1,0,2,3],[1,0,3,1]]
Output: 6
Explanation: A total area of 6 is covered by all three rectangles, as illustrated in the picture.
From (1,1) to (2,2), the green and red rectangles overlap.
From (1,0) to (2,3), all three rectangles overlap.
Example 2:
Input: rectangles = [[0,0,1000000000,1000000000]]
Output: 49
Explanation: The answer is 1018 modulo (109 + 7), which is 49.
Constraints:
1 <= rectangles.length <= 200rectanges[i].length == 40 <= xi1, yi1, xi2, yi2 <= 109xi1 <= xi2yi1 <= yi2Problem Overview: Given multiple axis-aligned rectangles, compute the total area covered by them. Overlapping regions must be counted only once. Coordinates can be large, so the result is typically returned modulo 1e9+7. The challenge is efficiently handling overlapping intervals across many rectangles.
Approach 1: Line Sweep Using Event Sorting (O(n log n) time, O(n) space)
This approach treats every rectangle edge as an event in a vertical line sweep. For each rectangle, create two events: entering at x1 and leaving at x2. As you sweep from left to right, maintain active y-intervals and compute their merged length. The area added between two x-coordinates equals the merged vertical coverage multiplied by the horizontal distance moved. Maintaining intervals typically requires sorting and merging, giving O(n log n) complexity.
Approach 2: Inclusion-Exclusion Principle (O(n^2) time, O(1) extra space)
The inclusion-exclusion idea computes rectangle areas individually and subtracts pairwise overlaps. For two rectangles, compute the intersection region and subtract it from the sum of their areas. Extending this logic to multiple rectangles requires careful overlap handling and quickly becomes quadratic or worse. This method demonstrates the overlap concept but does not scale well for large inputs.
Approach 3: Scanline with Segment Tree (O(n log n) time, O(n) space)
This is the most robust solution and commonly expected in interviews. After sorting x-events, compress all unique y coordinates and maintain coverage counts in a segment tree. Each node tracks how much vertical length is currently covered. When processing an event, update the interval [y1, y2) with +1 or -1. The tree instantly returns the total active vertical length, allowing you to compute area contribution between consecutive x positions efficiently.
Approach 4: Line Sweeping with Interval Addition (O(n log n) time, O(n) space)
This variant keeps active intervals in an ordered structure such as a balanced tree or ordered set. When rectangles start or end, intervals are inserted or removed. The active intervals are merged to calculate the current vertical coverage. Compared to the segment tree method, this implementation is simpler but requires careful merging logic and can have higher constant factors.
Recommended for interviews: The scanline with segment tree approach. A basic sweep-line explanation shows you understand how overlapping areas accumulate, but the segment tree version demonstrates strong algorithmic design and efficient interval aggregation. Most competitive programming and system-level interview solutions use this pattern.
This approach involves treating rectangle edges as events (start and end), which we can sort and process sequentially. By sweeping across the x-axis and using a data structure, like Segment Tree or Balance Tree, to merge y-intervals, we can efficiently calculate the union area of rectangles.
The solution uses a line sweep algorithm where rectangles are decomposed into events indicating if a horizontal segment is starting or ending. These events are sorted by the x-coordinate and processed to update the active intervals on the y-axis. A helper function manages merging y-intervals actively covered, calculating the cumulative area exposed over the previous segment width.
Python
Time Complexity: O(N^2 log N), where N is the number of rectangles. Sorting events takes O(N log N), and updating y-interval intervals can be up to O(N) operations for each event.
Space Complexity: O(N) for storing events and active intervals structures.
This approach involves using the inclusion-exclusion principle to calculate the area by adding all single rectangle areas and subtracting all pairwise overlaps calculated recursively. The approach is computationally intensive for the direct calculation but less error-prone for conceptual integrity.
This Java implementation uses a TreeMap to keep track of active y-intervals, adding or removing intervals based on the type of event being processed. The expansion of the x-coordinate determines how much additional area to count between events. The TreeMap simplifies the merging and tracking of overlapping y-intervals.
Java
Time Complexity: O(N log N), where the log component comes from interval set operations inherent in TreeMap.
Space Complexity: O(N), mainly for storing events and active structures.
This approach uses the scanline technique combined with a segment tree to handle the union of rectangles. The scanline approach will treat each x-coordinate boundary as an event, i.e., where a rectangle starts or ends. These events allow efficient checking with a segment tree, which tracks active y-intervals.
We define a Segment Tree to manage y-coordinates, offering efficient updates for overlapping segments and interval covering. We iterate over event points in sorted order, updating the segment tree for each x-coordinate while calculating the area contribution to the result. Using modulo operation keeps the result scaled within bounds.
Python
JavaScript
Time complexity: O(N log N), where N is the number of events. This arises from sorting the events and using a segment tree for dynamic interval management.
Space complexity: O(N), for storing sorted y-coordinates and constructing the segment tree.
In this approach, we handle the vertical lines or events by consolidating intervals along the x-direction using coordinate compression. The active intervals along the y-axis are populated dynamically as the events are processed. Unlike a Segment Tree, this approach uses a simpler interval tracking to combine overlapping y-segments.
This approach defines events across x-coordinates, adjusting interval coverage along the y-axis using count to handle rectangle entry and exits succinctly. By employing coordinate compression and a simple interval logic, it systematically accumulates the total covered area.
Time complexity: O(N log N), given the sorting of events and y-coordinates.
Space complexity: O(N), for event storage and y-indices tracking.
| Approach | Complexity |
|---|---|
| Approach 1: Line Sweep Using Event Sorting | Time Complexity: O(N^2 log N), where N is the number of rectangles. Sorting events takes O(N log N), and updating y-interval intervals can be up to O(N) operations for each event. |
| Approach 2: Inclusion-Exclusion Principle | Time Complexity: O(N log N), where the log component comes from interval set operations inherent in TreeMap. |
| Approach 1: Scanline with Segment Tree | Time complexity: O(N log N), where N is the number of events. This arises from sorting the events and using a segment tree for dynamic interval management. |
| Approach 2: Line Sweeping with Interval Addition | Time complexity: O(N log N), given the sorting of events and y-coordinates. |
| Default Approach | — |
| Approach | Time | Space | When to Use |
|---|---|---|---|
| Inclusion-Exclusion Principle | O(n^2) | O(1) | Conceptual understanding of overlapping rectangles or very small input sizes |
| Line Sweep with Event Sorting | O(n log n) | O(n) | General rectangle union problems where intervals can be merged dynamically |
| Scanline with Segment Tree | O(n log n) | O(n) | Best scalable solution for large inputs and common in competitive programming |
| Line Sweeping with Interval Addition | O(n log n) | O(n) | When using ordered sets or balanced trees to maintain active intervals |
Rectangle Area II | Geometry | Maths | Line Sweep | 850 LeetCode | Day 22 • CodeWithSunny • 6,906 views views
Watch 9 more video solutions →Practice Rectangle Area II with our built-in code editor and test cases.
Practice on FleetCodePractice this problem
Open in Editor