
Projection Area of 3D Shapes - Solution & Explanation
Problem Statement
You are given an n x n grid where we place some 1 x 1 x 1 cubes that are axis-aligned with the x, y, and z axes.
Each value v = grid[i][j] represents a tower of v cubes placed on top of the cell (i, j).
We view the projection of these cubes onto the xy, yz, and zx planes.
A projection is like a shadow, that maps our 3-dimensional figure to a 2-dimensional plane. We are viewing the "shadow" when looking at the cubes from the top, the front, and the side.
Return the total area of all three projections.
Example 1:
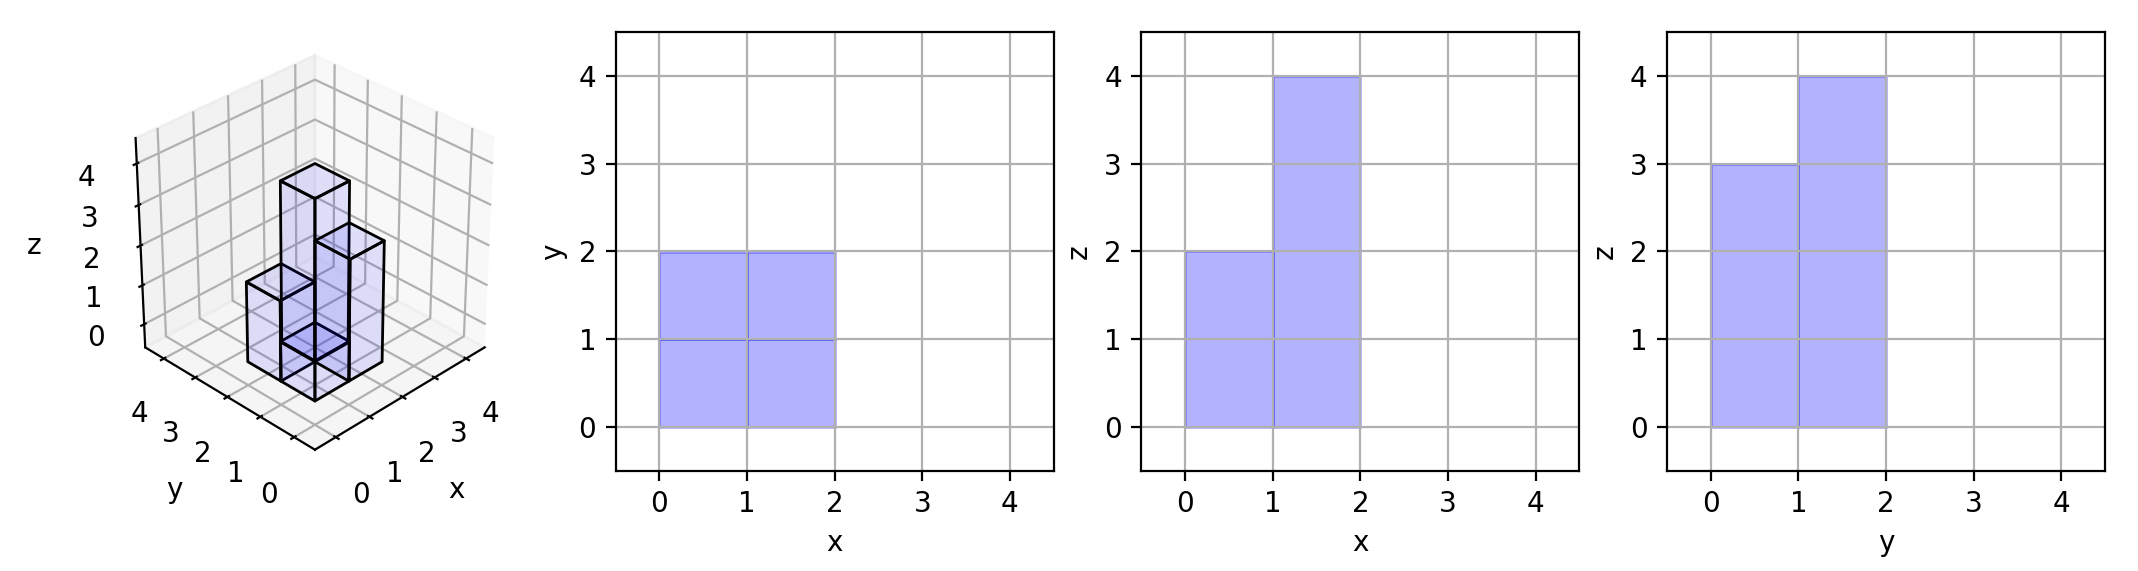
Input: grid = [[1,2],[3,4]]
Output: 17
Explanation: Here are the three projections ("shadows") of the shape made with each axis-aligned plane.
Example 2:
Input: grid = [[2]]
Output: 5
Example 3:
Input: grid = [[1,0],[0,2]]
Output: 8
Constraints:
n == grid.length == grid[i].length1 <= n <= 500 <= grid[i][j] <= 50
Approach Overview
Problem Overview: You are given an n x n grid where each cell represents a stack of cubes. The task is to compute the total projection area when the 3D structure is projected onto the XY (top), YZ (front), and ZX (side) planes. Each projection reveals different visible surfaces based on cube heights.
Approach 1: Simulation of Projections (O(m*n) time, O(1) space)
Directly simulate what each projection would look like. The top projection (XY plane) counts how many cells contain at least one cube. Iterate through the grid and increment the area whenever grid[i][j] > 0. The front projection (YZ plane) depends on the tallest stack in each row, so compute the maximum value in every row and add them together. The side projection (ZX plane) depends on the tallest stack in each column, which you can compute by scanning column-wise while iterating the grid.
This method works because each projection reduces the 3D structure to a simple 2D visibility rule: presence for the top view, row maximum for the front view, and column maximum for the side view. A single nested loop can compute the top area and track row/column maximums simultaneously. The approach relies only on simple iteration and comparisons over a matrix, making it straightforward and efficient.
Approach 2: Pre-compute Row and Column Maximums (O(m*n) time, O(m+n) space)
Instead of calculating projections during traversal, pre-compute auxiliary arrays. First iterate through the grid and maintain two arrays: rowMax[i] for the tallest stack in each row and colMax[j] for the tallest stack in each column. At the same time, count the number of non‑zero cells for the top projection. Once traversal is complete, sum all values in rowMax to get the front projection and sum colMax for the side projection.
This separation improves clarity because each projection becomes an independent calculation derived from precomputed information. The technique is common when working with arrays and matrix traversal problems where row and column aggregates are reused. Memory usage increases slightly due to the extra arrays, but the logic becomes easier to reason about.
Recommended for interviews: The simulation approach is typically expected. It demonstrates that you understand how each geometric projection works and how to derive them using simple iteration over the grid. The row/column pre-computation variant shows stronger organization and can make the code cleaner, but both approaches run in the same optimal O(m*n) time using basic math and geometry reasoning.
Approach 1: Simulation of Projections
In this approach, we calculate each plane's projection separately, then sum them up for the total projection area. For the XY-plane projection, we count every cell with a positive value. For the YZ-plane, we determine the maximum value in each row (representing the view from the side). For the ZX-plane, we find the maximum value in each column (representing the view from the front).
This C implementation uses nested loops to traverse the grid and calculate projection areas separately for each plane, accumulating the resulting areas for the total projection.
Complexity
Time Complexity: O(n^2) since we traverse each grid element once.
Space Complexity: O(1) since we use no additional space proportional to the input size.
Approach 2: Pre-compute Column and Row Maximums
This approach improves upon the earlier method by precomputing the maximum values in each row and column before calculating the projections. By storing these values in separate arrays, it helps avoid repeatedly calculating max values within nested loops for each axis projection.
This C solution uses arrays to store the maximums of rows and columns, improving efficiency slightly from not recalculating these values repeatedly.
Complexity
Time Complexity: O(n^2) to fill the grid, row, and column arrays.
Space Complexity: O(n) to store column maximums.
Approach 3: Mathematics
We can calculate the area of the three projections separately.
- Projection area on the xy plane: Each non-zero value will be projected onto the xy plane, so the projection area on the xy plane is the count of non-zero values.
- Projection area on the yz plane: The maximum value in each row.
- Projection area on the zx plane: The maximum value in each column.
Finally, add up the three areas.
The time complexity is O(n^2), where n is the side length of the grid grid. The space complexity is O(1).
Complexity Comparison
| Approach | Complexity |
|---|---|
| Simulation of Projections | Time Complexity: O(n^2) since we traverse each grid element once. |
| Pre-compute Column and Row Maximums | Time Complexity: O(n^2) to fill the grid, row, and column arrays. |
| Mathematics | — |
Detailed Complexity Analysis
| Approach | Time | Space | When to Use |
|---|---|---|---|
| Simulation of Projections | O(m*n) | O(1) | Best general solution. Minimal memory usage and easy to compute projections during traversal. |
| Pre-compute Row and Column Maximums | O(m*n) | O(m+n) | When cleaner code is preferred or row/column aggregates are reused later. |
Video Solution
LeetCode Algorithms Easy: Projection Area of 3D Shapes • Mike the Coder • 2,313 views views
Watch 9 more video solutions →Frequently Asked Questions
Is Projection Area of 3D Shapes easy or hard?
Projection Area of 3D Shapes Python/Java solution
How to solve Projection Area of 3D Shapes in O(n)?
What is the best approach for Projection Area of 3D Shapes?
Is Projection Area of 3D Shapes asked at Google/Amazon/Meta?
What data structure is used in Projection Area of 3D Shapes?
What is the time complexity of Projection Area of 3D Shapes?
Ready to solve this problem?
Practice Projection Area of 3D Shapes with our built-in code editor and test cases.
Practice on FleetCode