You are given m x n grid image which represents a grayscale image, where image[i][j] represents a pixel with intensity in the range [0..255]. You are also given a non-negative integer threshold.
Two pixels are adjacent if they share an edge.
A region is a 3 x 3 subgrid where the absolute difference in intensity between any two adjacent pixels is less than or equal to threshold.
All pixels in a region belong to that region, note that a pixel can belong to multiple regions.
You need to calculate a m x n grid result, where result[i][j] is the average intensity of the regions to which image[i][j] belongs, rounded down to the nearest integer. If image[i][j] belongs to multiple regions, result[i][j] is the average of the rounded-down average intensities of these regions, rounded down to the nearest integer. If image[i][j] does not belong to any region, result[i][j] is equal to image[i][j].
Return the grid result.
Example 1:
Input: image = [[5,6,7,10],[8,9,10,10],[11,12,13,10]], threshold = 3
Output: [[9,9,9,9],[9,9,9,9],[9,9,9,9]]
Explanation:
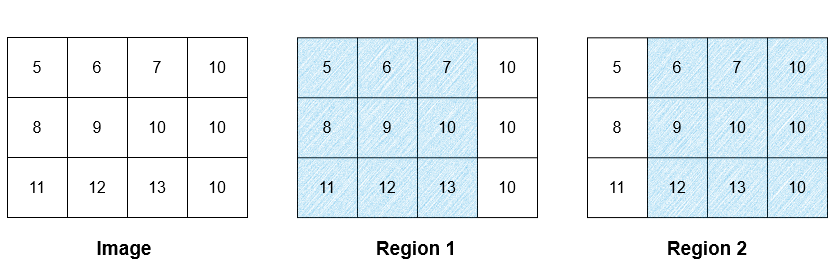
There are two regions as illustrated above. The average intensity of the first region is 9, while the average intensity of the second region is 9.67 which is rounded down to 9. The average intensity of both of the regions is (9 + 9) / 2 = 9. As all the pixels belong to either region 1, region 2, or both of them, the intensity of every pixel in the result is 9.
Please note that the rounded-down values are used when calculating the average of multiple regions, hence the calculation is done using 9 as the average intensity of region 2, not 9.67.
Example 2:
Input: image = [[10,20,30],[15,25,35],[20,30,40],[25,35,45]], threshold = 12
Output: [[25,25,25],[27,27,27],[27,27,27],[30,30,30]]
Explanation:
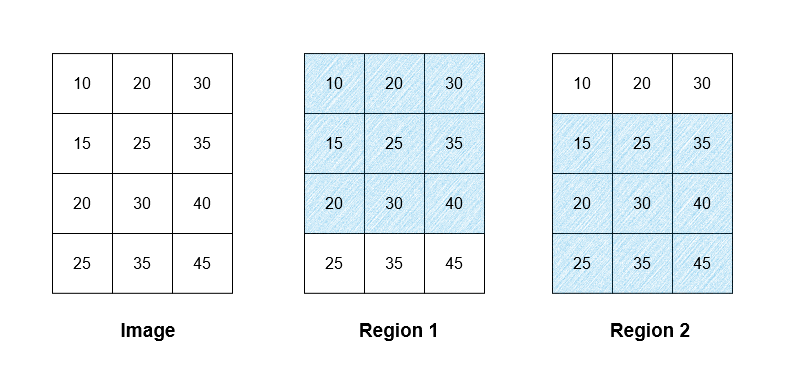
There are two regions as illustrated above. The average intensity of the first region is 25, while the average intensity of the second region is 30. The average intensity of both of the regions is (25 + 30) / 2 = 27.5 which is rounded down to 27.
All the pixels in row 0 of the image belong to region 1, hence all the pixels in row 0 in the result are 25. Similarly, all the pixels in row 3 in the result are 30. The pixels in rows 1 and 2 of the image belong to region 1 and region 2, hence their assigned value is 27 in the result.
Example 3:
Input: image = [[5,6,7],[8,9,10],[11,12,13]], threshold = 1
Output: [[5,6,7],[8,9,10],[11,12,13]]
Explanation:
There is only one 3 x 3 subgrid, while it does not have the condition on difference of adjacent pixels, for example, the difference between image[0][0] and image[1][0] is |5 - 8| = 3 > threshold = 1. None of them belong to any valid regions, so the result should be the same as image.
Constraints:
3 <= n, m <= 5000 <= image[i][j] <= 2550 <= threshold <= 255Problem Overview: You receive an m x n image grid and a threshold. For every possible 3 x 3 region, check whether all adjacent cells inside the region differ by at most the threshold. If the region is valid, compute the floor of the average of its 9 values and contribute that value to every cell in the region. A cell may belong to multiple valid regions, so the final grid value becomes the average of all region averages covering that cell. If no valid region covers a cell, keep the original value.
Approach 1: Brute-Force Region Detection (O(m*n) time, O(m*n) space)
Iterate through the matrix and treat every cell (i, j) as the top-left corner of a potential 3 x 3 region. For each candidate region, verify the constraint by checking all horizontal and vertical adjacent pairs inside the region. There are only a fixed number of comparisons (12 adjacency checks), so validation is constant time. If the region satisfies the threshold condition, compute the sum of the 9 cells and derive the region average using integer division.
Maintain two helper matrices: one for accumulating the sum of region averages affecting each cell and another for counting how many valid regions contributed to that cell. When a valid region is found, add its computed average to all 9 cells and increment their counters. After scanning the entire grid, compute the final result cell-by-cell: if the counter is greater than zero, divide the accumulated sum by the count; otherwise copy the original pixel value.
This approach works well because the region size is fixed. Even though every cell may trigger a region check, each validation and averaging step touches only 9 cells, making the total runtime proportional to the grid size. The technique relies heavily on systematic iteration over a matrix and careful boundary handling.
Approach 2: Prefix Sum Assisted Averaging (O(m*n) time, O(m*n) space)
You can slightly streamline the average calculation by precomputing a 2D prefix sum of the grid. This allows constant-time retrieval of any 3 x 3 region sum instead of summing the nine elements directly. The adjacency validation still requires checking neighbors within the region, but the averaging step becomes a single prefix-sum query.
In practice the improvement is minor because the region size is small, but prefix sums can help if the region size becomes variable in a follow-up question. This pattern appears frequently in array and matrix range-sum problems.
Recommended for interviews: The brute-force region detection approach is typically expected. It demonstrates that you can systematically scan a grid, validate local constraints, and correctly handle overlapping contributions. Prefix sums are a reasonable optimization discussion but rarely necessary given the fixed 3x3 window.
This approach involves iterating over every possible 3x3 subgrid in the image. For each subgrid, check if all adjacent pixels satisfy the threshold condition. If they do, calculate the average intensity of the subgrid and assign it to every pixel in the grid.
For each pixel, we maintain a list of intensities it contributes to, and calculate the final intensity by averaging these contributions.
This code outlines a solution to the problem using a brute-force approach. We check every possible 3x3 subgrid in the image to verify if it satisfies the region conditions based on the threshold. If so, compute the average intensity of the subgrid. Then, update the result image with the average values.
Note that the method checks valid adjacent pixels within each subgrid by checking differences between pixel intensities, and accumulates valid subgrid averages for overlapping pixels.
Time Complexity: O(m * n), where m and n are dimensions of the image. The nested iteration over 3x3 subgrids also requires examining 9 elements, but this is constant time for each subgrid.
Space Complexity: O(m * n) for the result storage.
Python
Java
C++
Go
TypeScript
| Approach | Complexity |
|---|---|
| Brute-Force Region Detection | Time Complexity: O(m * n), where m and n are dimensions of the image. The nested iteration over 3x3 subgrids also requires examining 9 elements, but this is constant time for each subgrid. Space Complexity: O(m * n) for the result storage. |
| Default Approach | — |
| Approach | Time | Space | When to Use |
|---|---|---|---|
| Brute-Force 3x3 Region Detection | O(m*n) | O(m*n) | Best general solution since each region has constant size and validation is simple. |
| Prefix Sum Assisted Averaging | O(m*n) | O(m*n) | Useful when region sizes vary or when many range-sum queries are required. |
3030. Find the Grid of Region Average | Array | Matrix | Weekly Contest 383 • Aryan Mittal • 1,612 views views
Watch 5 more video solutions →Practice Find the Grid of Region Average with our built-in code editor and test cases.
Practice on FleetCodePractice this problem
Open in Editor