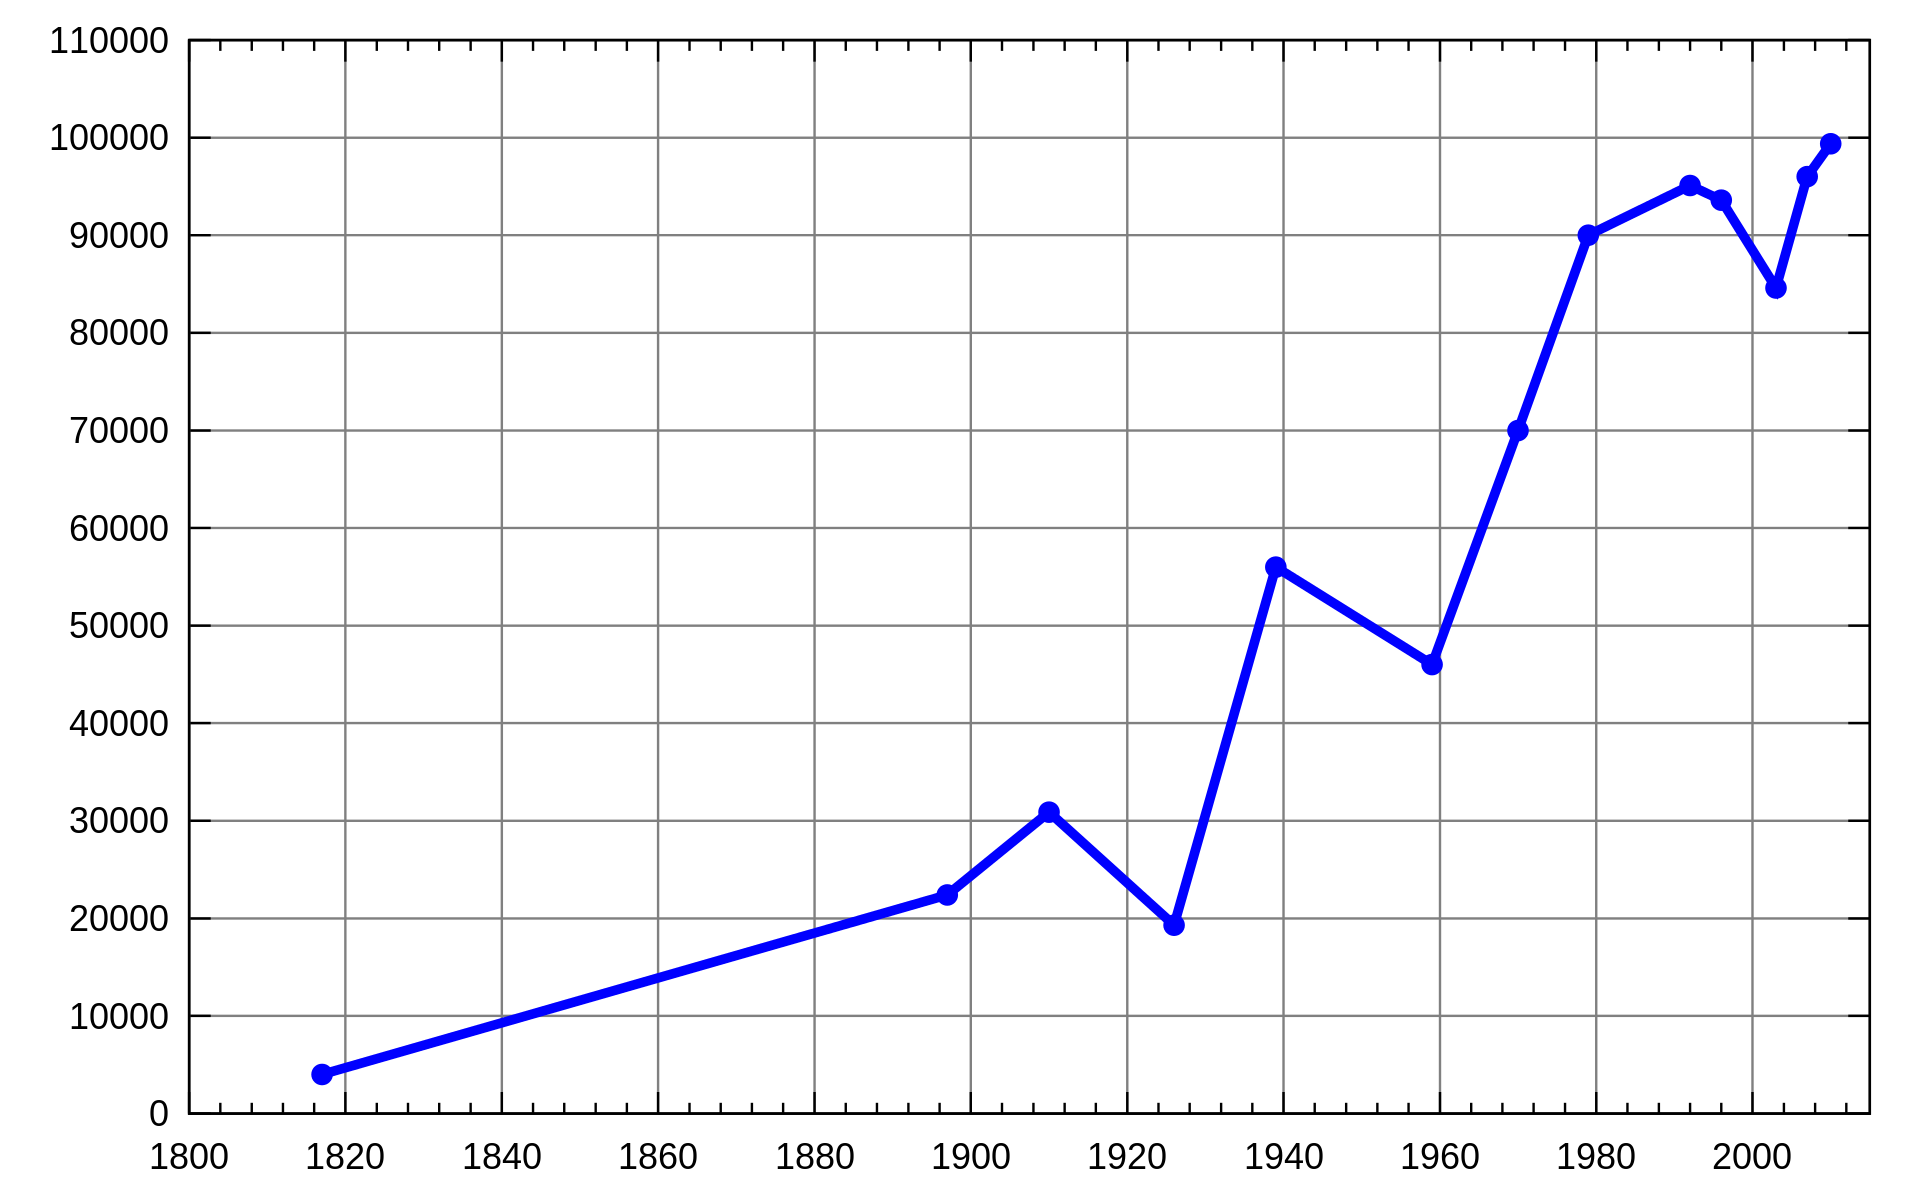
You are given a 2D integer array stockPrices where stockPrices[i] = [dayi, pricei] indicates the price of the stock on day dayi is pricei. A line chart is created from the array by plotting the points on an XY plane with the X-axis representing the day and the Y-axis representing the price and connecting adjacent points. One such example is shown below:
Return the minimum number of lines needed to represent the line chart.
Example 1:
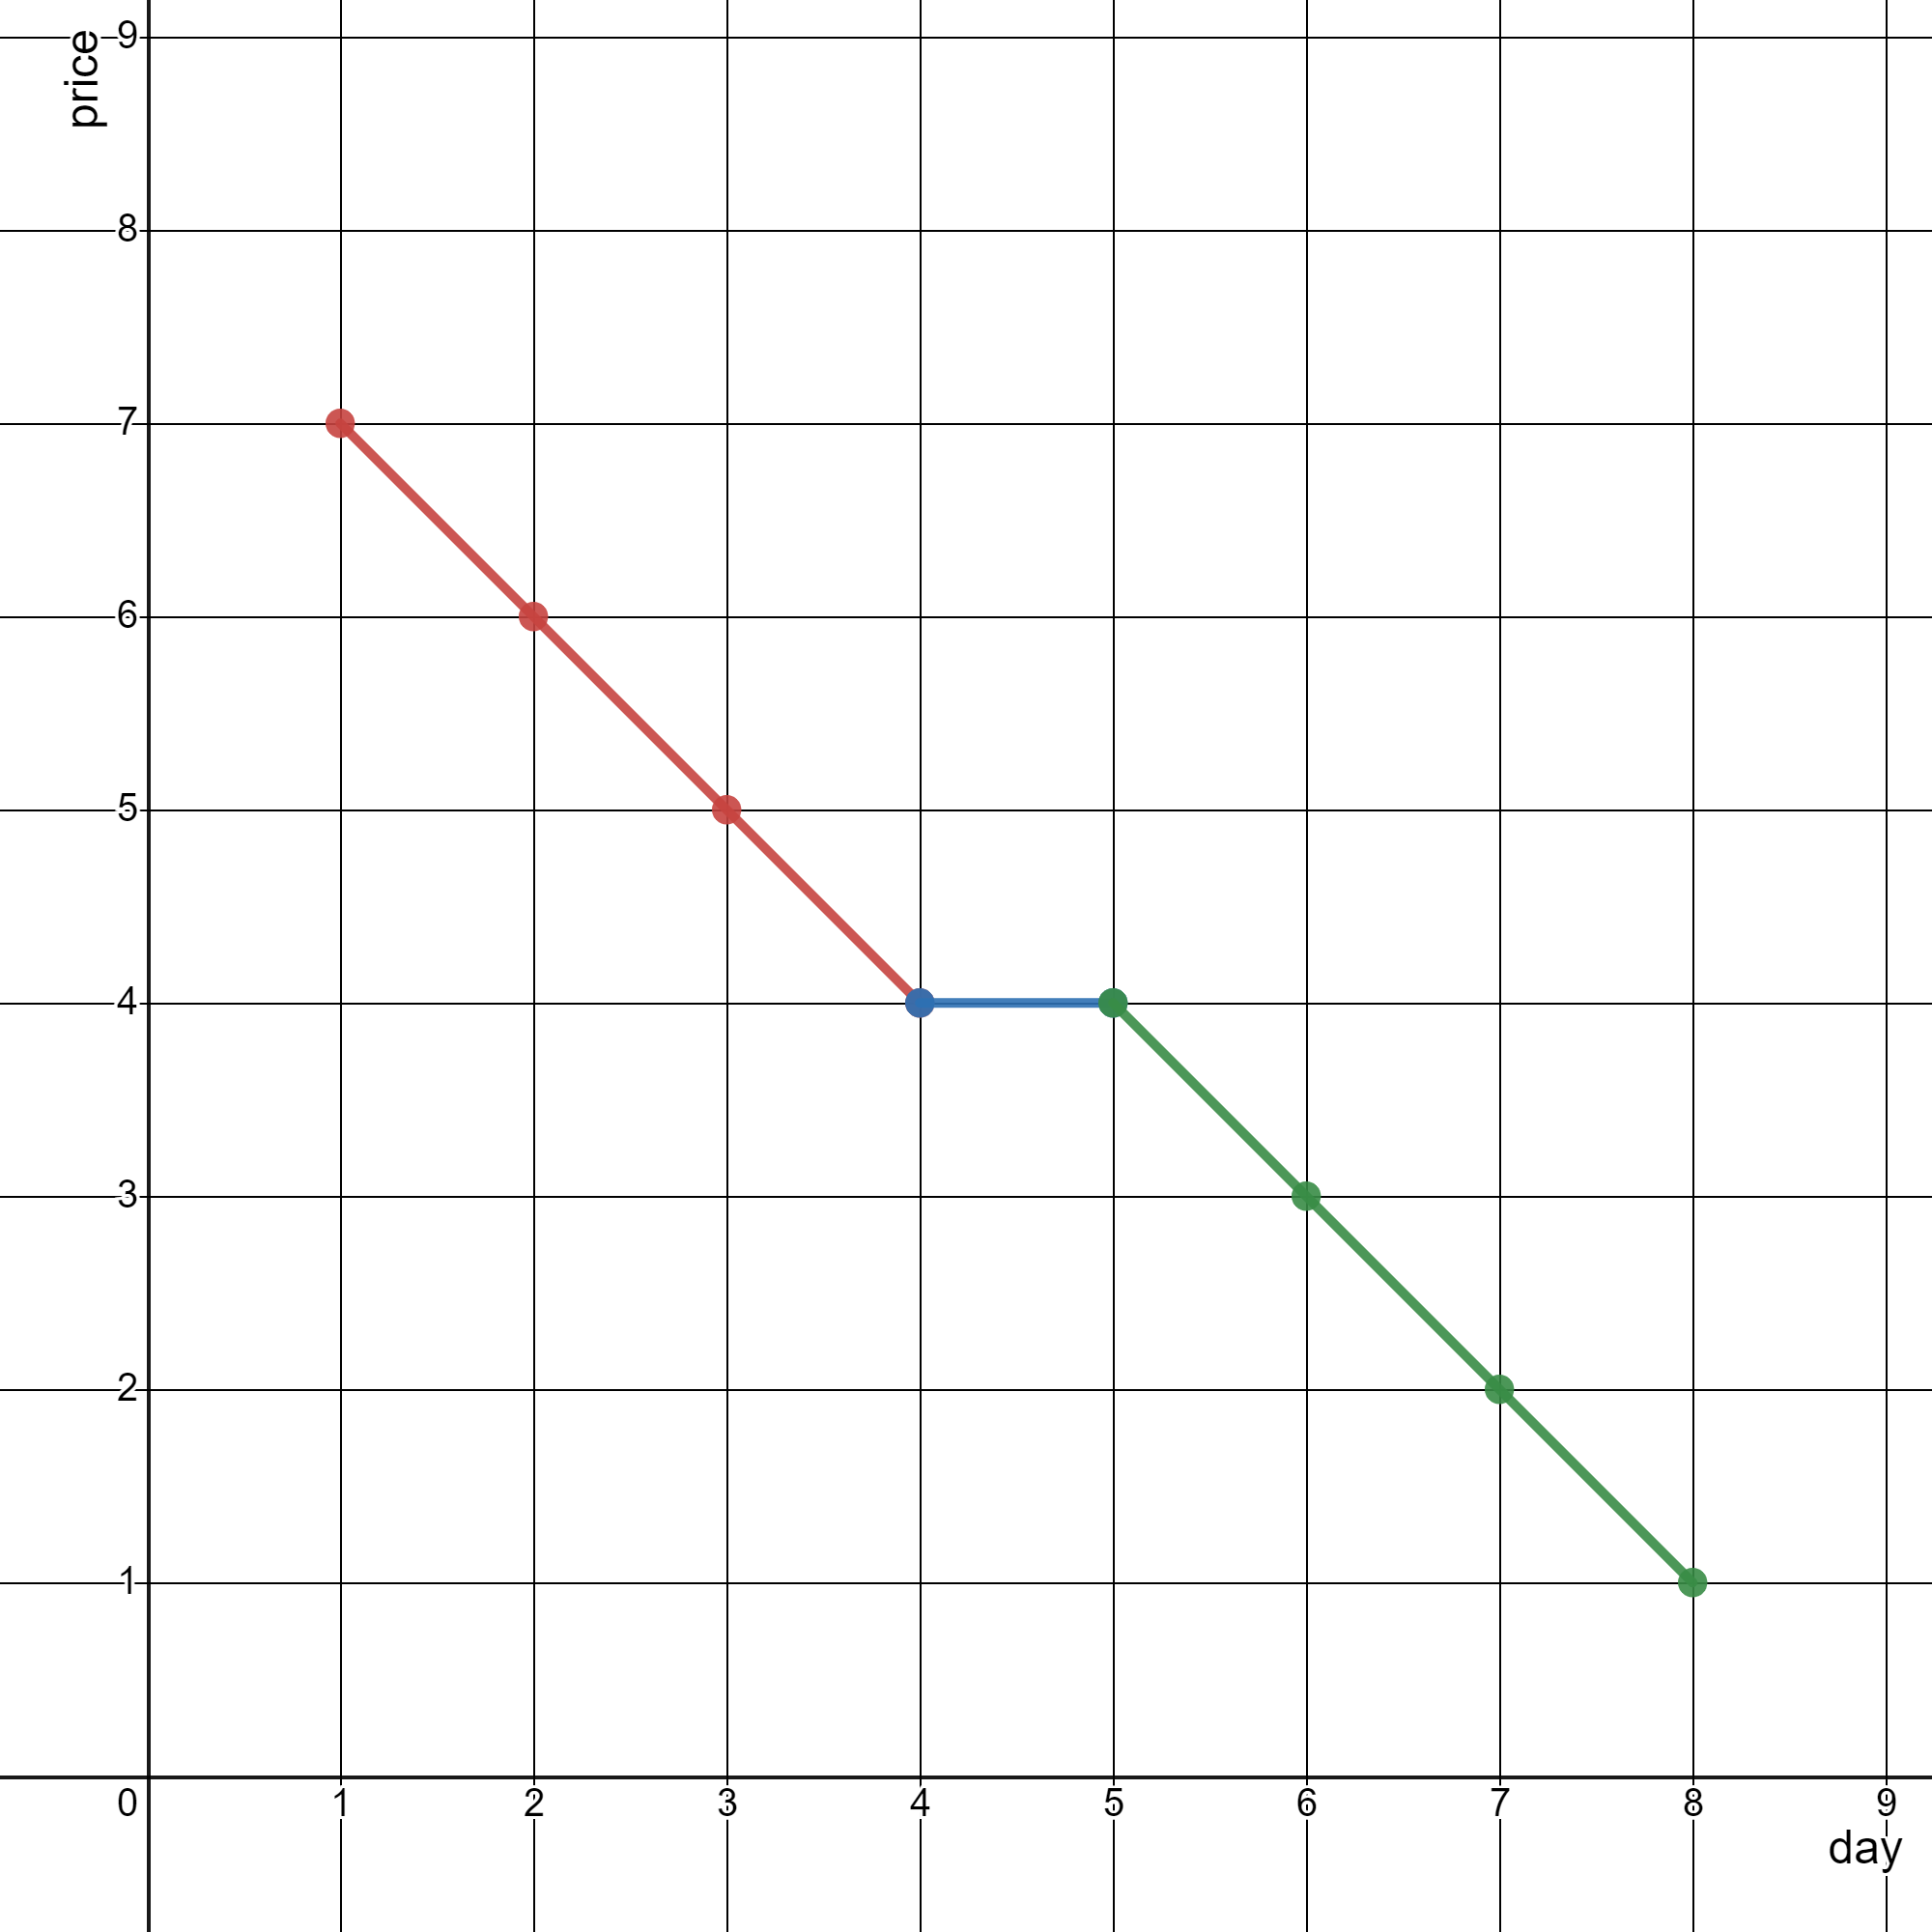
Input: stockPrices = [[1,7],[2,6],[3,5],[4,4],[5,4],[6,3],[7,2],[8,1]]
Output: 3
Explanation:
The diagram above represents the input, with the X-axis representing the day and Y-axis representing the price.
The following 3 lines can be drawn to represent the line chart:
- Line 1 (in red) from (1,7) to (4,4) passing through (1,7), (2,6), (3,5), and (4,4).
- Line 2 (in blue) from (4,4) to (5,4).
- Line 3 (in green) from (5,4) to (8,1) passing through (5,4), (6,3), (7,2), and (8,1).
It can be shown that it is not possible to represent the line chart using less than 3 lines.
Example 2:
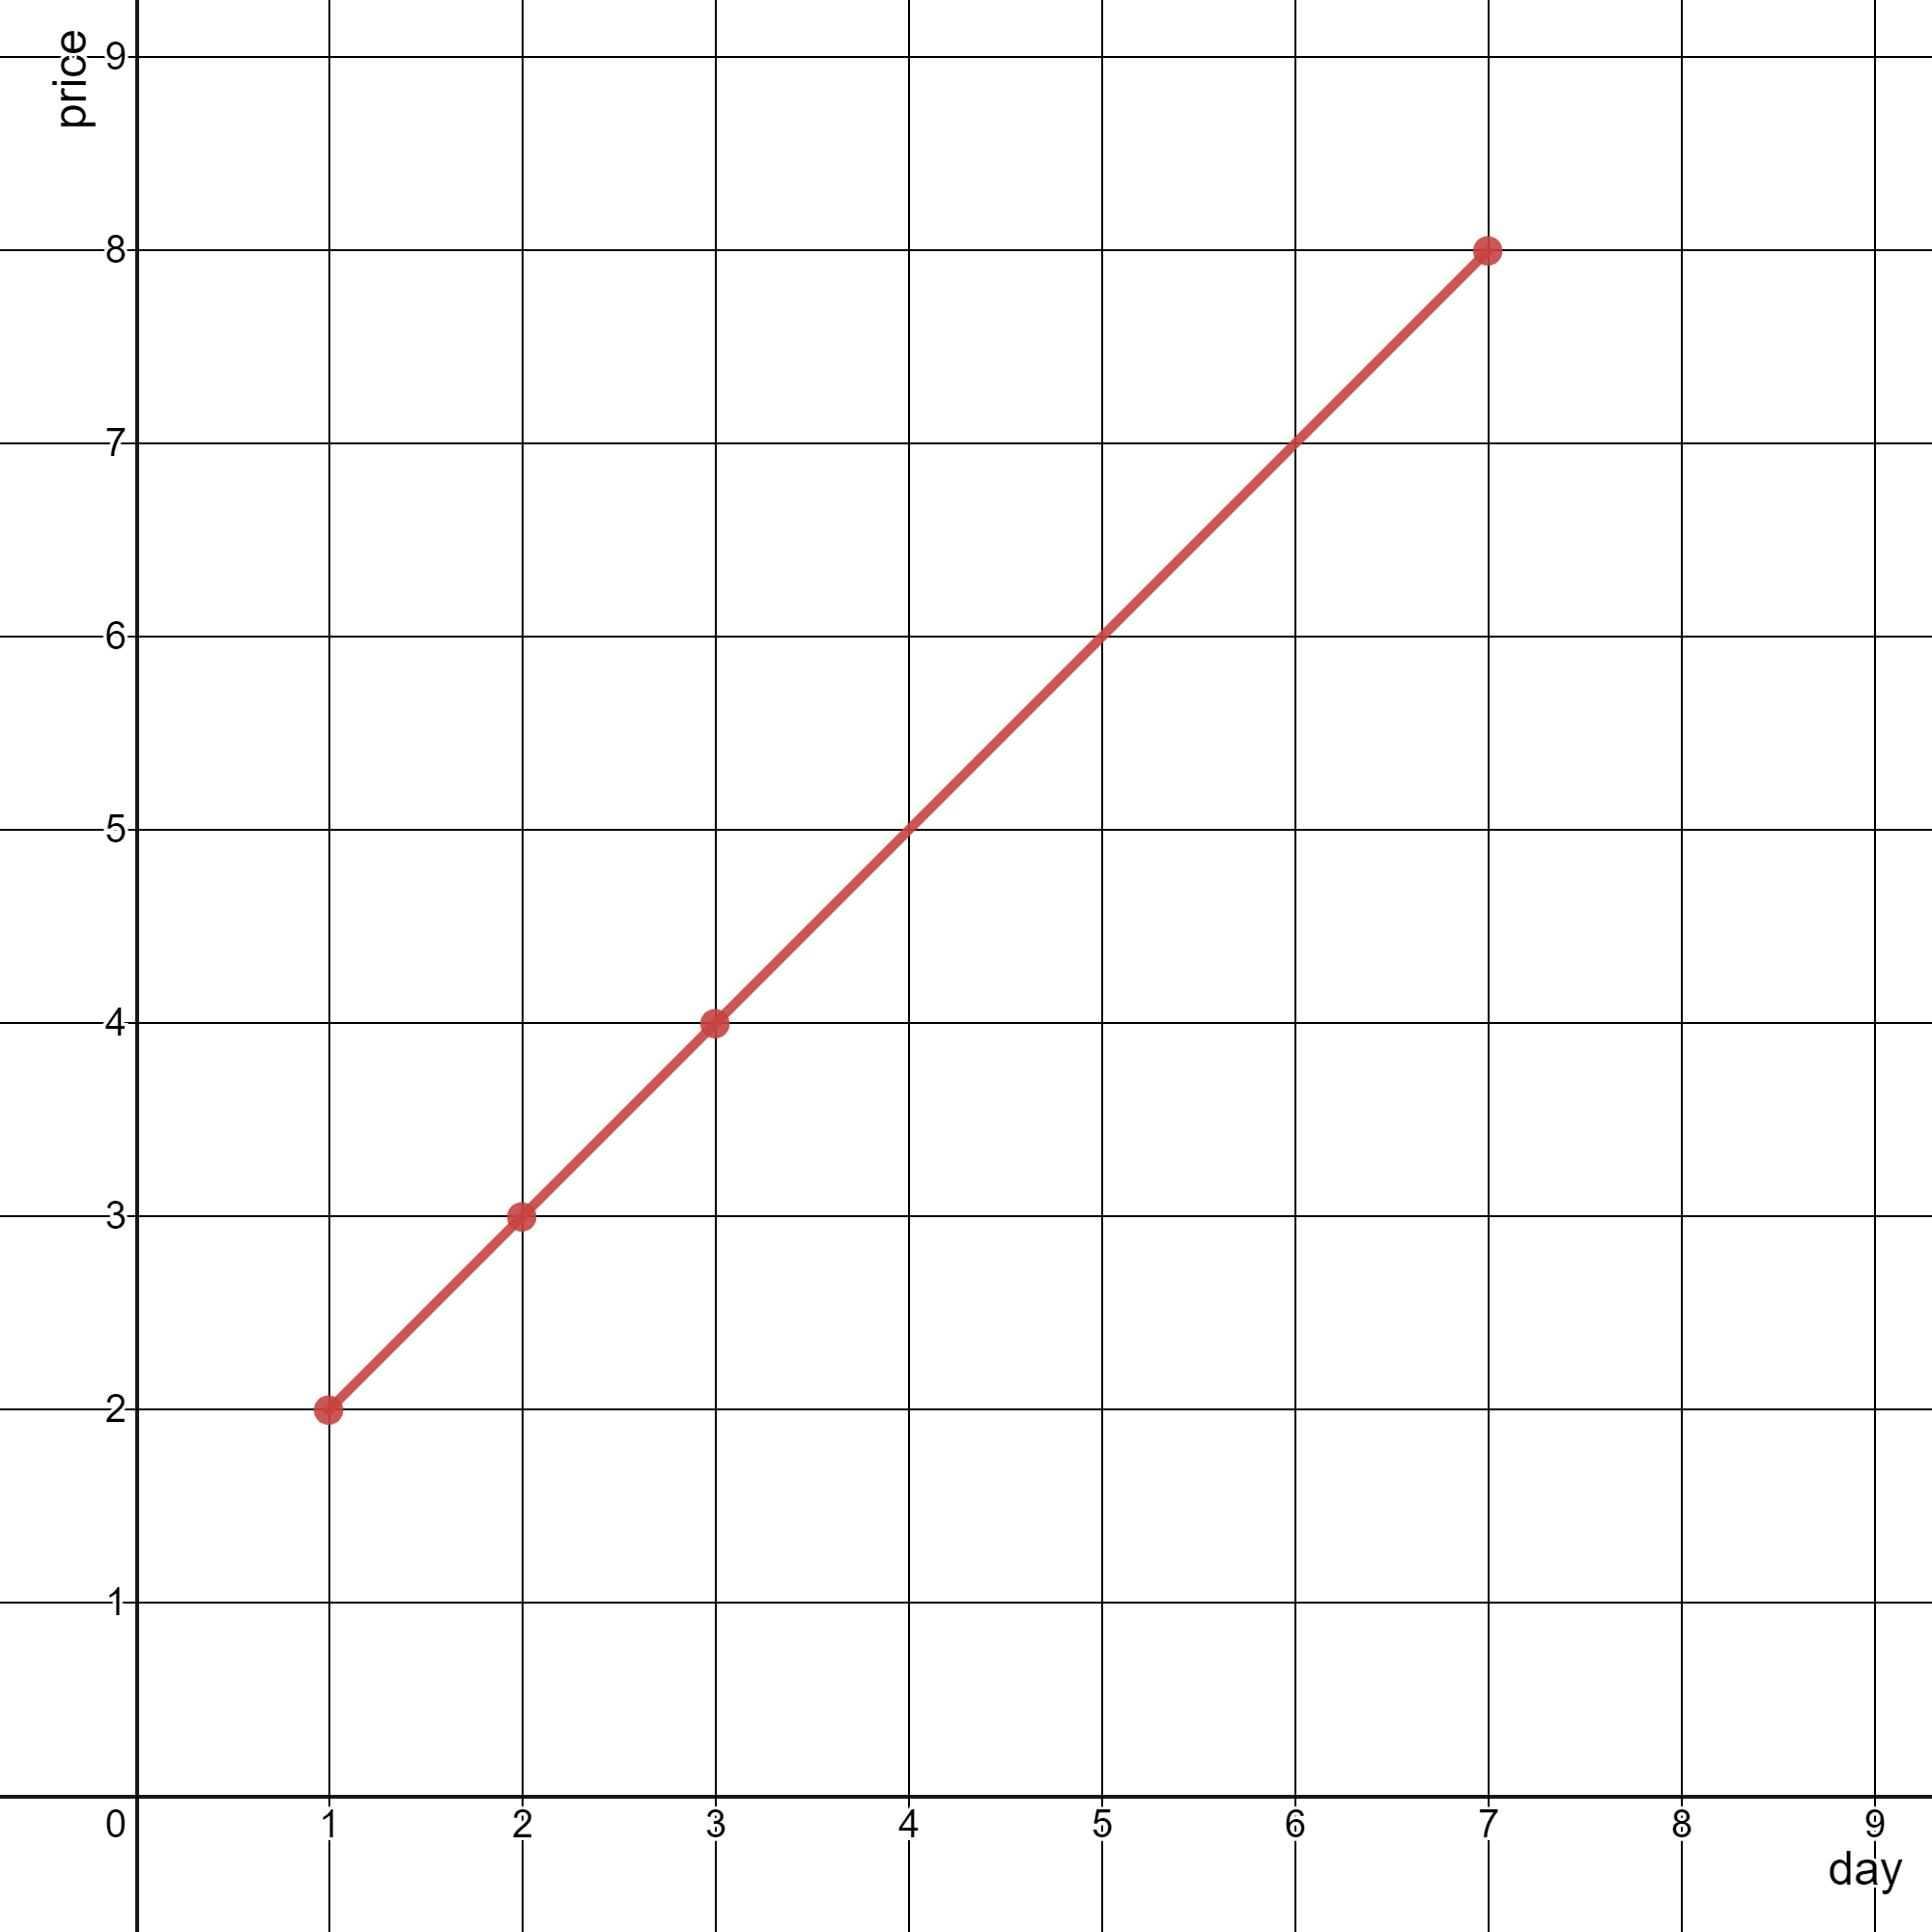
Input: stockPrices = [[3,4],[1,2],[7,8],[2,3]]
Output: 1
Explanation:
As shown in the diagram above, the line chart can be represented with a single line.
Constraints:
1 <= stockPrices.length <= 105stockPrices[i].length == 21 <= dayi, pricei <= 109dayi are distinct.In #2280 Minimum Lines to Represent a Line Chart, you are given stock prices with days on the x-axis and prices on the y-axis. The goal is to determine the minimum number of straight line segments needed to represent the chart when points are connected in chronological order.
A common strategy is to first sort the points by their x-coordinate (day). Then iterate through consecutive points and track the slope between pairs of points. If the slope between the current pair differs from the previous slope, a new line segment must begin. To avoid floating-point precision issues, slopes can be compared using (y2 - y1) * (x3 - x2) and (y3 - y2) * (x2 - x1) (cross multiplication).
This method efficiently counts slope changes while scanning the sorted array. Sorting dominates the complexity, giving a time complexity of O(n log n), while the traversal itself is linear with O(1) additional space.
| Approach | Time Complexity | Space Complexity |
|---|---|---|
| Sorting + slope comparison | O(n log n) | O(1) |
| Single pass after sorting | O(n) | O(1) |
Greg Hogg
Use these hints if you're stuck. Try solving on your own first.
When will three adjacent points lie on the same line? How can we generalize this for all points?
Will calculating the slope of lines connecting adjacent points help us find the answer?
Watch expert explanations and walkthroughs
Practice problems asked by these companies to ace your technical interviews.
Explore More ProblemsJot down your thoughts, approach, and key learnings
Sorting ensures the points are processed in chronological order along the x-axis. Since the chart connects points in order, sorting guarantees correct slope comparisons between consecutive points.
Yes, similar slope comparison and geometry-based array problems are common in FAANG-style interviews. They test knowledge of sorting, mathematical reasoning, and careful handling of precision issues.
An array or vector is sufficient for this problem. After sorting the array of points, a simple linear traversal with slope comparison is enough to count the minimum number of line segments.
The optimal approach sorts the points by their x-coordinate and then checks the slope between consecutive pairs. Whenever the slope changes, a new line segment is required. Cross multiplication is used to compare slopes accurately without floating-point errors.