
Number of Transactions per Visit - Solution & Explanation
Problem Statement
Table: Visits
+---------------+---------+
| Column Name   | Type    |
+---------------+---------+
| user_id       | int     |
| visit_date    | date    |
+---------------+---------+
(user_id, visit_date) is the primary key (combination of columns with unique values) for this table.
Each row of this table indicates that user_id has visited the bank in visit_date.
Table: Transactions
+------------------+---------+
| Column Name      | Type    |
+------------------+---------+
| user_id          | int     |
| transaction_date | date    |
| amount           | int     |
+------------------+---------+
This table may contain duplicates rows.
Each row of this table indicates that user_id has done a transaction of amount in transaction_date.
It is guaranteed that the user has visited the bank in the transaction_date.(i.e The Visits table contains (user_id, transaction_date) in one row)
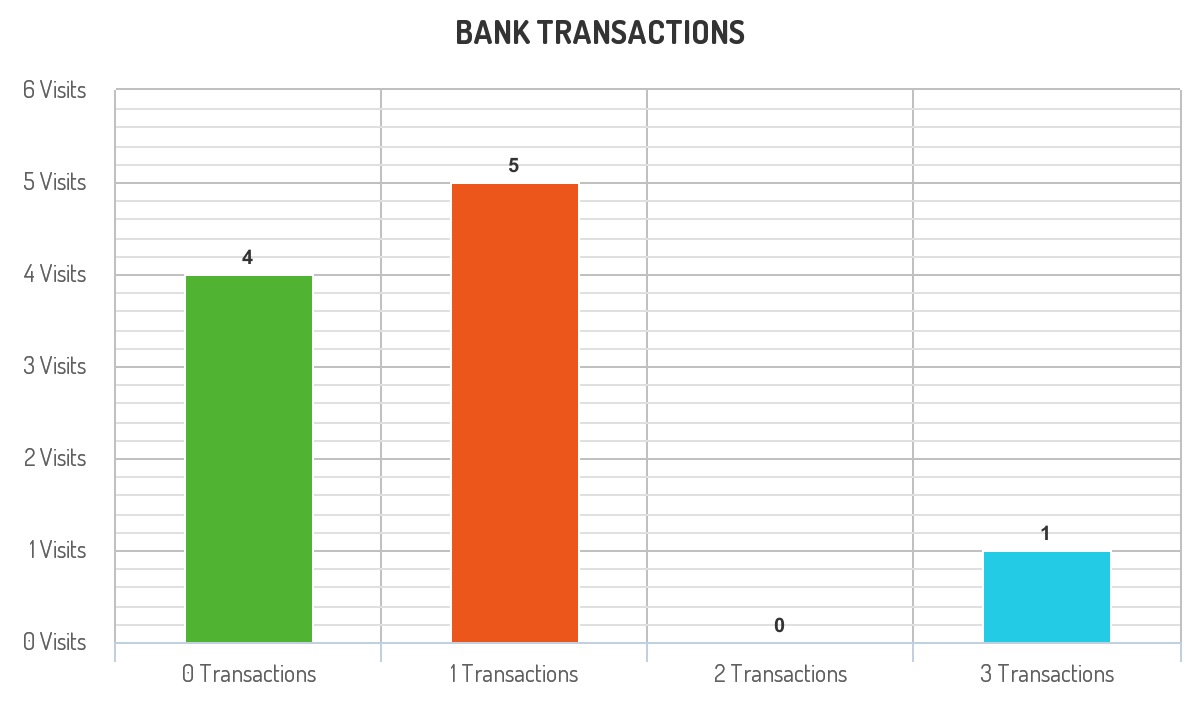
A bank wants to draw a chart of the number of transactions bank visitors did in one visit to the bank and the corresponding number of visitors who have done this number of transaction in one visit.
Write a solution to find how many users visited the bank and didn't do any transactions, how many visited the bank and did one transaction, and so on.
The result table will contain two columns:
transactions_countwhich is the number of transactions done in one visit.visits_countwhich is the corresponding number of users who didtransactions_countin one visit to the bank.
transactions_count should take all values from 0 to max(transactions_count) done by one or more users.
Return the result table ordered by transactions_count.
The result format is in the following example.
Example 1:
Input:
Visits table:
+---------+------------+
| user_id | visit_date |
+---------+------------+
| 1       | 2020-01-01 |
| 2       | 2020-01-02 |
| 12      | 2020-01-01 |
| 19      | 2020-01-03 |
| 1       | 2020-01-02 |
| 2       | 2020-01-03 |
| 1       | 2020-01-04 |
| 7       | 2020-01-11 |
| 9       | 2020-01-25 |
| 8       | 2020-01-28 |
+---------+------------+
Transactions table:
+---------+------------------+--------+
| user_id | transaction_date | amount |
+---------+------------------+--------+
| 1       | 2020-01-02       | 120    |
| 2       | 2020-01-03       | 22     |
| 7       | 2020-01-11       | 232    |
| 1       | 2020-01-04       | 7      |
| 9       | 2020-01-25       | 33     |
| 9       | 2020-01-25       | 66     |
| 8       | 2020-01-28       | 1      |
| 9       | 2020-01-25       | 99     |
+---------+------------------+--------+
Output:
+--------------------+--------------+
| transactions_count | visits_count |
+--------------------+--------------+
| 0                  | 4            |
| 1                  | 5            |
| 2                  | 0            |
| 3                  | 1            |
+--------------------+--------------+
Explanation: The chart drawn for this example is shown above.
* For transactions_count = 0, The visits (1, "2020-01-01"), (2, "2020-01-02"), (12, "2020-01-01") and (19, "2020-01-03") did no transactions so visits_count = 4.
* For transactions_count = 1, The visits (2, "2020-01-03"), (7, "2020-01-11"), (8, "2020-01-28"), (1, "2020-01-02") and (1, "2020-01-04") did one transaction so visits_count = 5.
* For transactions_count = 2, No customers visited the bank and did two transactions so visits_count = 0.
* For transactions_count = 3, The visit (9, "2020-01-25") did three transactions so visits_count = 1.
* For transactions_count >= 4, No customers visited the bank and did more than three transactions so we will stop at transactions_count = 3
Approach Overview
Problem Overview: You have two tables: Visits and Transactions. Each visit may have zero or more transactions. The task is to compute how many visits had exactly k transactions and return the distribution for every value from 0 up to the maximum transactions observed.
Approach 1: Count Transactions per Visit with LEFT JOIN (O(V + T) time, O(V) space)
Start by computing how many transactions belong to each visit. Use a LEFT JOIN from Visits to Transactions so visits with zero transactions are preserved. Group by visit_id and count transaction_id. This produces a derived table where each row represents a visit and the number of transactions during that visit. The key insight is the LEFT JOIN: it ensures visits with no transactions appear with a count of 0, which is required for the final distribution.
Approach 2: Aggregate the Distribution of Transaction Counts (O(V) time, O(K) space)
Once you know the transaction count per visit, group again by that count. For example, if five visits had exactly two transactions, the result row should be transactions_count = 2 and visits_count = 5. This step uses SQL aggregation with GROUP BY transactions_count. The number of groups depends on the maximum transaction count K, which is usually small compared to the number of visits.
Approach 3: Generate Missing Transaction Counts (0..max) (O(K) time, O(K) space)
The result must include transaction counts that never occurred. For example, if no visit had exactly three transactions, the output still needs a row for 3 with 0 visits. Generate the sequence from 0 to MAX(transactions_count) using a recursive CTE or a derived numbers table. Then LEFT JOIN this sequence with the aggregated results and replace missing values using COALESCE. This guarantees a continuous range of transaction counts.
This problem mainly tests SQL aggregation and join strategy. Understanding how LEFT JOIN preserves unmatched rows is critical. You also need to handle missing values by generating a numeric sequence and merging it with the aggregated results. These patterns appear frequently in analytics-style SQL problems.
Relevant concepts include database queries, SQL aggregation, and SQL joins. Problems that require counting distributions or filling gaps often rely on the same techniques.
Recommended for interviews: The expected approach combines a LEFT JOIN to compute transactions per visit and a generated sequence to fill missing counts. A candidate who first derives the per‑visit transaction count shows clear reasoning. Extending it to produce the full distribution demonstrates strong SQL fluency.
Solution
Code
MySQL
Detailed Complexity Analysis
| Approach | Time | Space | When to Use |
|---|---|---|---|
| LEFT JOIN to count transactions per visit | O(V + T) | O(V) | Base step when you need the number of transactions for every visit, including visits with zero transactions |
| Group by transaction count to build distribution | O(V) | O(K) | Used after computing per‑visit counts to determine how many visits fall into each transaction bucket |
| Generate sequence 0..max with recursive CTE and join | O(K) | O(K) | When the result must include missing transaction counts that did not appear in the data |
Video Solution
Leetcode HARD 1336 - RECURSIVE CTE SQL Explained - Transactions Per Visit | Everyday Data Science • Everyday Data Science • 1,090 views views
Watch 2 more video solutions →Frequently Asked Questions
Is Number of Transactions per Visit easy or hard?
Number of Transactions per Visit Python/Java solution
How to solve Number of Transactions per Visit in O(n)?
What is the best approach for Number of Transactions per Visit?
Is Number of Transactions per Visit asked at Google/Amazon/Meta?
What data structure is used in Number of Transactions per Visit?
What is the time complexity of Number of Transactions per Visit?
Ready to solve this problem?
Practice Number of Transactions per Visit with our built-in code editor and test cases.
Practice on FleetCode