Find Churn Risk Customers solution and explanation

5 more videos on this problem
 Leetcode MEDIUM 3716 - ROW_NUMBER() Ranking in SQL - Churn Risk Customer | Everyday Data ScienceEveryday Data Science · 10:26 · 752 views
 3716. Find Churn Risk Customers | Product Base CompaniesData Portfolio · 34:50 · 102 views
 🫠Master CTEs & Joins: Solving LeetCode 3716 Find Churn Risk Customers (Medium SQL)👍🏻Vivek The Analyst · 13:55 · 29 views
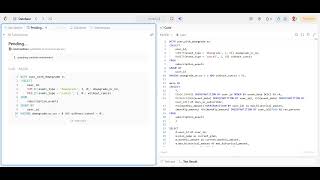 LeetCode SQL Problem - Find Churn Risk Customers #leetcode #sqlRanvir Singh Matharu · 0:17 · 6 views
 LeetCode, SQL, 3716. Find Churn Risk Customers, MediumДиванная аналитика · 45:10 · 4 views
 LeetCode, Pandas, 3716. Find Churn Risk Customers, MediumДиванная аналитика · 26:06
The problem
Table: subscription_events
+------------------+---------+
| Column Name      | Type    |
+------------------+---------+
| event_id         | int     |
| user_id          | int     |
| event_date       | date    |
| event_type       | varchar |
| plan_name        | varchar |
| monthly_amount   | decimal |
+------------------+---------+
event_id is the unique identifier for this table.
event_type can be start, upgrade, downgrade, or cancel.
plan_name can be basic, standard, premium, or NULL (when event_type is cancel).
monthly_amount represents the monthly subscription cost after this event.
For cancel events, monthly_amount is 0.
Write a solution to Find Churn Risk Customers - users who show warning signs before churning. A user is considered churn risk customer if they meet ALL the following criteria:
- Currently have an active subscription (their last event is not cancel).
- Have performed at least one downgrade in their subscription history.
- Their current plan revenue is less than
50%of their historical maximum plan revenue. - Have been a subscriber for at least
60days.
Return the result table ordered by days_as_subscriber in descending order, then by user_id in ascending order.
The result format is in the following example.
Example:
Input:
subscription_events table:
+----------+---------+------------+------------+-----------+----------------+
| event_id | user_id | event_date | event_type | plan_name | monthly_amount |
+----------+---------+------------+------------+-----------+----------------+
| 1        | 501     | 2024-01-01 | start      | premium   | 29.99          |
| 2        | 501     | 2024-02-15 | downgrade  | standard  | 19.99          |
| 3        | 501     | 2024-03-20 | downgrade  | basic     | 9.99           |
| 4        | 502     | 2024-01-05 | start      | standard  | 19.99          |
| 5        | 502     | 2024-02-10 | upgrade    | premium   | 29.99          |
| 6        | 502     | 2024-03-15 | downgrade  | basic     | 9.99           |
| 7        | 503     | 2024-01-10 | start      | basic     | 9.99           |
| 8        | 503     | 2024-02-20 | upgrade    | standard  | 19.99          |
| 9        | 503     | 2024-03-25 | upgrade    | premium   | 29.99          |
| 10       | 504     | 2024-01-15 | start      | premium   | 29.99          |
| 11       | 504     | 2024-03-01 | downgrade  | standard  | 19.99          |
| 12       | 504     | 2024-03-30 | cancel     | NULL      | 0.00           |
| 13       | 505     | 2024-02-01 | start      | basic     | 9.99           |
| 14       | 505     | 2024-02-28 | upgrade    | standard  | 19.99          |
| 15       | 506     | 2024-01-20 | start      | premium   | 29.99          |
| 16       | 506     | 2024-03-10 | downgrade  | basic     | 9.99           |
+----------+---------+------------+------------+-----------+----------------+
Output:
+----------+--------------+------------------------+-----------------------+--------------------+
| user_id  | current_plan | current_monthly_amount | max_historical_amount | days_as_subscriber |
+----------+--------------+------------------------+-----------------------+--------------------+
| 501      | basic        | 9.99                   | 29.99                 | 79                 |
| 502      | basic        | 9.99                   | 29.99                 | 70                 |
+----------+--------------+------------------------+-----------------------+--------------------+
Explanation:
- User 501:
- Currently active: Last event is downgrade to basic (not cancelled)
- Has downgrades: Yes, 2 downgrades in history
- Current revenue (9.99) vs max (29.99): 9.99/29.99 = 33.3% (less than 50%)
- Days as subscriber: Jan 1 to Mar 20 = 79 days (at least 60)
- Result: Churn Risk Customer
- User 502:
- Currently active: Last event is downgrade to basic (not cancelled)
- Has downgrades: Yes, 1 downgrade in history
- Current revenue (9.99) vs max (29.99): 9.99/29.99 = 33.3% (less than 50%)
- Days as subscriber: Jan 5 to Mar 15 = 70 days (at least 60)
- Result: Churn Risk Customer
- User 503:
- Currently active: Last event is upgrade to premium (not cancelled)
- Has downgrades: No downgrades in history
- Result: Not at-risk (no downgrade history)
- User 504:
- Currently active: Last event is cancel
- Result: Not at-risk (subscription cancelled)
- User 505:
- Currently active: Last event is 'upgrade' to standard (not cancelled)
- Has downgrades: No downgrades in history
- Result: Not at-risk (no downgrade history)
- User 506:
- Currently active: Last event is downgrade to basic (not cancelled)
- Has downgrades: Yes, 1 downgrade in history
- Current revenue (9.99) vs max (29.99): 9.99/29.99 = 33.3% (less than 50%)
- Days as subscriber: Jan 20 to Mar 10 = 50 days (less than 60)
- Result: Not at-risk (insufficient subscription duration)
Result table is ordered by days_as_subscriber DESC, then user_id ASC.
Note: days_as_subscriber is calculated from the first event date to the last event date for each user.
Approach overview
Problem Overview: You have customer records and their transactions. Flag the customers who match the churn risk conditions defined in the problem, and return them. The work is a per-customer aggregation followed by a filter, so the whole problem reduces to one question: which aggregate values do you compute, and where do you apply the conditions?
Approach 1: Correlated Subquery per Customer (O(C × T) time, O(1) extra space)
For each customer row, run a subquery against the transactions table that computes the metrics you need, such as counts, sums, or date-based figures, and filter on the result. This is the most literal translation of the problem statement, so it is easy to write correctly on the first pass. The cost is that the inner subquery re-scans transactions for every customer. Without an index on customer_id, that is O(C × T) where C is the number of customers and T is the number of transactions. Use it to confirm your logic, not as the final answer.
Approach 2: Group By, Join, and Conditional Filtering (O(T + C) time, O(C) space)
Compute all per-customer metrics in one pass with GROUP BY customer_id, then JOIN that result back to the customers table so you can return names or other fields. Put the churn conditions in a HAVING clause on the aggregates, or in a WHERE clause on the joined result if the condition is on customer attributes. The database does one scan over transactions and builds a hash or sorted group table with one entry per customer. That makes the work linear in the input size, plus the cost of the join. Conditional aggregation (SUM(CASE WHEN ... THEN 1 ELSE 0 END)) lets you compute several filtered counts in a single pass, which avoids a second scan for each condition. In Pandas, the same pattern is groupby("customer_id").agg(...), then merge with customers, then boolean indexing on the result.
Use this approach when the table is large or when you need several metrics per customer. It also keeps the query readable because each concept has its own step: aggregate, join, filter.
Recommended for interviews: Interviewers expect Approach 2. The correlated subquery shows you understand the requirement, but the grouped aggregation with a join and conditional filter shows you know how the database processes the data. State the complexity of both, explain why the first re-scans the table, and then write the grouped version. Mention the index on customer_id as the next optimization if the interviewer asks about scale. Related topics: Database, Aggregation, and Joins.
Solution
Thinking
Churn risk depends on both the latest event and the whole subscription history (start date, peak fee, downgrade count). Sorting by user and taking the last row of each group yields the current state; joining it with the grouped aggregates filters users who have not cancelled, have downgraded, now pay less than half their peak, and have subscribed for at least
60days.
We first use a window function to get the last record for each user sorted by event date and event ID in descending order, obtaining the latest event information for each user. Then, we group and aggregate the subscription history information for each user, including the subscription start date, last event date, historical maximum subscription fee, and the number of downgrade events. Finally, we join the latest event information with the historical statistics and filter according to the conditions specified in the problem to get the list of customers at risk of churn.
WITH
    user_with_last_event AS (
        SELECT
            s.*,
            ROW_NUMBER() OVER (
                PARTITION BY user_id
                ORDER BY event_date DESC, event_id DESC
            ) AS rn
        FROM subscription_events s
    ),
    user_history AS (
        SELECT
            user_id,
            MIN(event_date) AS start_date,
            MAX(event_date) AS last_event_date,
            MAX(monthly_amount) AS max_historical_amount,
            SUM(
                CASE
                    WHEN event_type = 'downgrade' THEN 1
                    ELSE 0
                END
            ) AS downgrade_count
        FROM subscription_events
        GROUP BY user_id
    ),
    latest_event AS (
        SELECT
            user_id,
            event_type AS last_event_type,
            plan_name AS current_plan,
            monthly_amount AS current_monthly_amount
        FROM user_with_last_event
        WHERE rn = 1
    )
SELECT
    l.user_id,
    l.current_plan,
    l.current_monthly_amount,
    h.max_historical_amount,
    DATEDIFF(h.last_event_date, h.start_date) AS days_as_subscriber
FROM
    latest_event l
    JOIN user_history h ON l.user_id = h.user_id
WHERE
    l.last_event_type <> 'cancel'
    AND h.downgrade_count >= 1
    AND l.current_monthly_amount < 0.5 * h.max_historical_amount
    AND DATEDIFF(h.last_event_date, h.start_date) >= 60
ORDER BY days_as_subscriber DESC, l.user_id ASC;import pandas as pd
def find_churn_risk_customers(subscription_events: pd.DataFrame) -> pd.DataFrame:
subscription_events["event_date"] = pd.to_datetime(
subscription_events["event_date"]
)
subscription_events = subscription_events.sort_values(
["user_id", "event_date", "event_id"]
)
last_events = (
subscription_events.groupby("user_id")
.tail(1)[["user_id", "event_type", "plan_name", "monthly_amount"]]
.rename(
columns={
"event_type": "last_event_type",
"plan_name": "current_plan",
"monthly_amount": "current_monthly_amount",
}
)
)
agg_df = (
subscription_events.groupby("user_id")
.agg(
start_date=("event_date", "min"),
last_event_date=("event_date", "max"),
max_historical_amount=("monthly_amount", "max"),
downgrade_count=("event_type", lambda x: (x == "downgrade").sum()),
)
.reset_index()
)
merged = pd.merge(agg_df, last_events, on="user_id", how="inner")
merged["days_as_subscriber"] = (
merged["last_event_date"] - merged["start_date"]
).dt.days
result = merged[
(merged["last_event_type"] != "cancel")
& (merged["downgrade_count"] >= 1)
& (merged["current_monthly_amount"] < 0.5 * merged["max_historical_amount"])
& (merged["days_as_subscriber"] >= 60)
][
[
"user_id",
"current_plan",
"current_monthly_amount",
"max_historical_amount",
"days_as_subscriber",
]
]
result = result.sort_values(
["days_as_subscriber", "user_id"], ascending=[False, True]
).reset_index(drop=True)
return resultComplexity analysis
| Approach | Time | Space | When to Use |
|---|---|---|---|
| Correlated Subquery per Customer | O(C × T) without index | O(1) extra | Small tables or quick correctness check |
| Group By + Join + Conditional Filter | O(T + C) | O(C) | General case and interviews; large transaction tables |
Frequently asked questions
Is Find Churn Risk Customers easy or hard?
Find Churn Risk Customers is a medium-difficulty problem with an acceptance rate of about 48.5%. The logic is straightforward once you see the aggregation step. Most errors come from putting a condition in the wrong clause (WHERE vs HAVING) or mishandling customers with no transactions.
How to solve Find Churn Risk Customers in O(n)?
Scan the transactions table once and compute the required metrics per customer_id using GROUP BY. Then join the grouped result to the customers table and filter on the churn conditions. Each transaction is visited once, so the work is linear in the number of rows.
Find Churn Risk Customers Python or Java solution?
The problem is designed for SQL, so the reference solution is a query. In Python, you can use Pandas with groupby("customer_id").agg(...), then merge with customers and filter with boolean indexing. Java solutions would need JDBC and a SQL query, so the SQL version is the standard answer.
What is the best approach for Find Churn Risk Customers?
The best approach is to aggregate transactions per customer with GROUP BY, join the result to the customers table, and apply the churn conditions with HAVING or WHERE. This scans the transactions table once and runs in linear time. Conditional aggregation with SUM(CASE WHEN ...) lets you compute several filtered metrics in the same pass.
What data structure is used in Find Churn Risk Customers?
The database uses a hash table or sorted group structure internally to hold one aggregate record per customer during GROUP BY. In Pandas, groupby builds a similar hash-based index. You write the logic in SQL or Pandas, so you do not implement the structure yourself.
What is the time complexity of Find Churn Risk Customers?
The optimal grouped solution runs in O(T + C) time, where T is the number of transactions and C is the number of customers. It uses O(C) extra space for the group table. A correlated subquery version runs in O(C × T) without an index on customer_id.
Is Find Churn Risk Customers asked at Google, Amazon, or Meta?
SQL aggregation problems like this one appear often in data-focused interview loops at large tech companies, including Amazon, Meta, and Google. Check the company tags on the problem page for the current list, since it changes over time.